


In simple terms, a Key Performance Indicator (KPI) is a number that tells you how well your call center is doing. Think of KPIs as the vital signs for your support operations, measuring everything from how fast your team works to how happy your customers are. They’re the tools that turn a flood of raw data into clear, actionable information.
Why Call Center KPIs Are Your Compass for Success

Could you imagine trying to navigate a ship across the ocean without a map or a compass? You might be moving, but you'd have no idea if you were getting closer to your destination. Running a call center without KPIs is pretty much the same gamble—you're just guessing.
These metrics are your navigation tools. They transform vague goals like "better customer service" into concrete, measurable targets you can actually hit. Without them, you’re flying blind. With them, you have the clarity to make smart decisions that get real results.
Moving from Guesswork to Strategy
KPIs give you the hard data you need to see what’s working and, just as importantly, what’s not. It takes the emotion out of performance reviews. You stop saying, "I think our agents are doing well," and start saying, "Our First Call Resolution rate has improved by 15% this quarter." This shift to data is the bedrock of real, continuous improvement.
By keeping a close eye on the right metrics, you can:
- Spot Your All-Stars: Figure out which agents, teams, or processes are knocking it out of the park so you can share their winning formula.
- Find the Bottlenecks: Quickly identify training gaps, clunky processes, or other issues that are dragging down performance and costing you money.
- Get Everyone on the Same Page: When everyone is working toward the same measurable goals, your entire operation becomes more focused and effective.
- Make a Case for Resources: Use solid numbers to justify requests for new software, more training, or a bigger team.
Thriving in a Competitive World
In today's service-driven economy, disciplined KPI tracking is more critical than ever. Take the United Arab Emirates (UAE), for example. The call center industry there is booming, part of a larger Asia Pacific market that makes up about 23% of global call center revenue—a market valued at roughly USD 72.56 billion in 2024.
This growth isn't accidental. It’s fueled by a skilled workforce and smart technology designed to improve key metrics like Average Handle Time (AHT) and First Call Resolution (FCR). In a market like this, mastering your KPIs isn’t just a nice-to-have; it’s a must-have to stay competitive and keep customers happy. You can learn more by exploring the Asia Pacific call center market trends.
At the end of the day, KPIs are the language of performance. They turn the daily chaos of a busy call center into a clear story about your progress, your challenges, and your opportunities for growth.
The Four Pillars of Call Center Performance Metrics
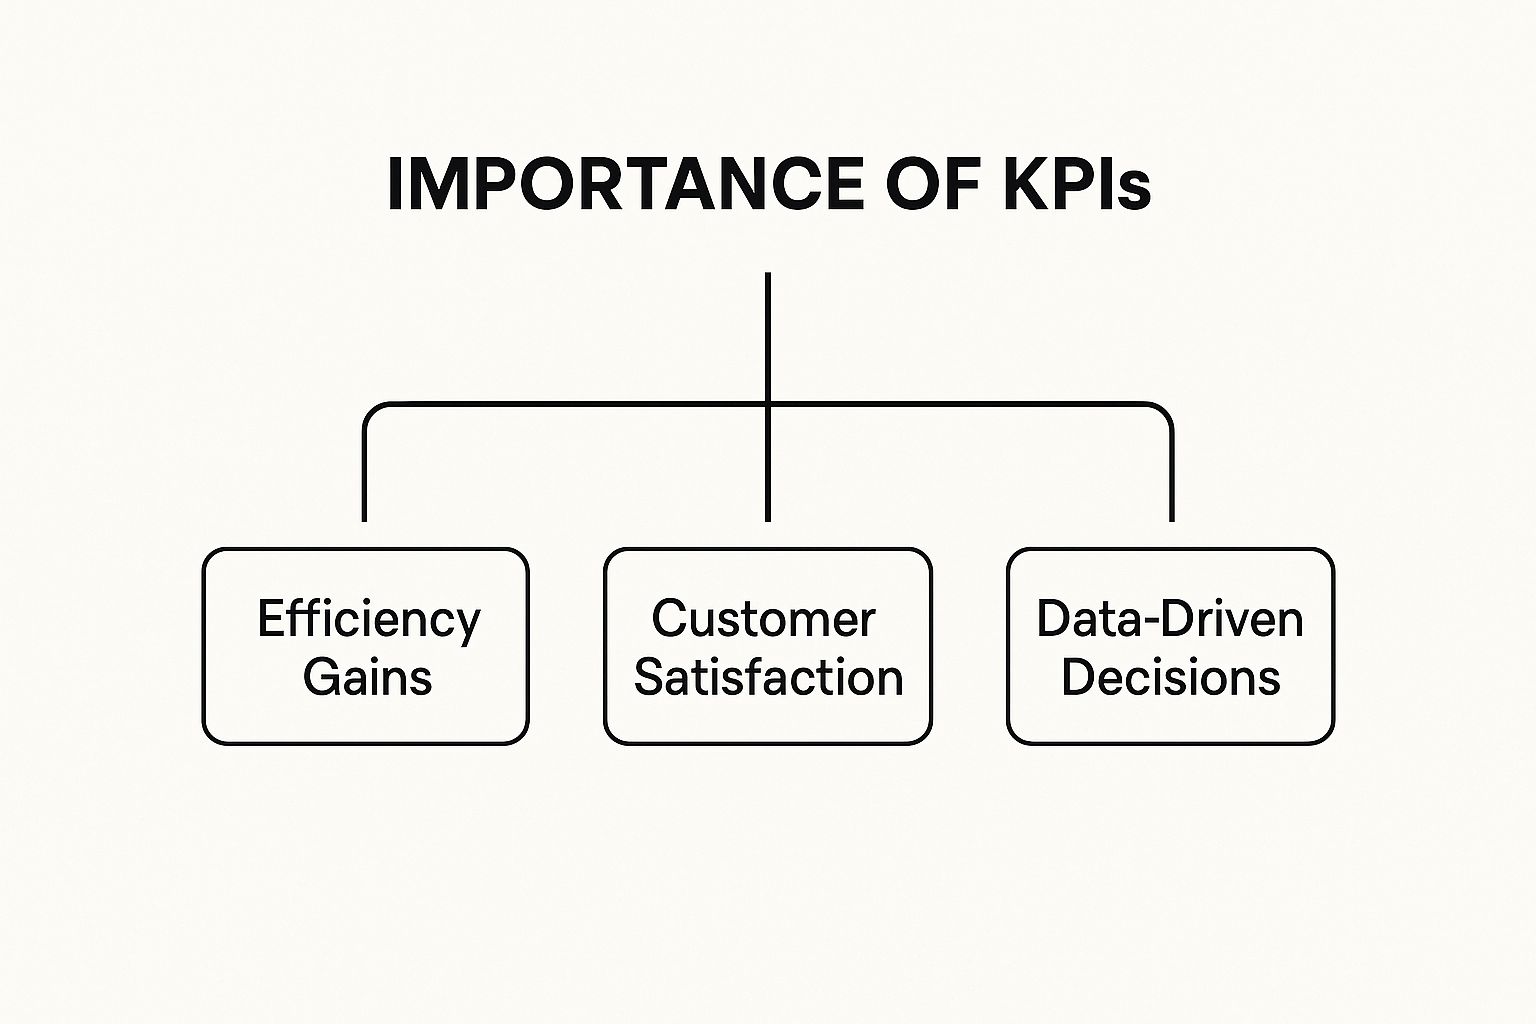
This image really gets to the heart of a solid KPI strategy. It's not just about numbers on a spreadsheet; it’s about creating a cycle of improvement. When you dial in your efficiency, customer satisfaction naturally follows, and that fuels the smart, data-backed decisions that push your entire operation forward.
If you're feeling lost in a sea of acronyms like AHT, FCR, and CSAT, you're not alone. The sheer volume of metrics can be paralyzing. The trick is to simplify. I’ve found the best way to make sense of it all is to group every KPI in a call center into four distinct pillars.
Thinking in terms of these pillars helps you connect the dots. You can start to see how high agent efficiency directly impacts your operational health, which in turn creates a better customer experience and, ultimately, healthier financial results. It all works together.
To provide a quick overview, here’s a breakdown of the four categories and what they focus on.
Understanding the Core Call Center KPI Categories
| KPI Category | Primary Focus | Example KPIs |
|---|---|---|
| Customer Experience | How customers perceive your service and brand loyalty. | CSAT, NPS, CES, FCR |
| Agent Efficiency | The productivity and performance of individual agents. | AHT, Agent Utilization, Schedule Adherence |
| Operational Health | The overall performance and stability of the entire call center. | Service Level, Abandonment Rate, Blockage Rate |
| Financial Impact | The connection between call center activities and business costs/revenue. | Cost Per Call, Revenue Per Call, Sales Conversion Rate |
This table serves as a handy reference, but let's dig into what each pillar truly represents and why it matters.
Pillar 1: Customer Experience KPIs
Let's start with the most important pillar: the customer experience. This is where you measure how people feel about interacting with your company. Get this right, and you create loyal customers who act as brand advocates. Get it wrong, and you risk damaging your reputation one bad call at a time.
Here are the heavy hitters in this category:
- Customer Satisfaction (CSAT): The classic "how did we do?" metric. It's usually a quick post-call survey that gives you an immediate pulse on customer happiness after a specific interaction.
- Net Promoter Score (NPS): This one looks at the bigger picture. It measures long-term loyalty by asking customers how likely they are to recommend your business to friends or family.
- Customer Effort Score (CES): A fantastic predictor of loyalty, CES asks a simple question: "How easy was it to get your issue resolved?" The less effort for the customer, the better.
- First Call Resolution (FCR): This might be the single biggest driver of customer satisfaction. It tracks the percentage of issues you solve on the very first try, without needing a callback or transfer.
Pillar 2: Agent Efficiency KPIs
These metrics zoom in on the productivity of your team. While it’s tempting to push for pure speed, that’s a classic mistake. Efficiency must always be balanced with quality. An agent rushing through calls might look good on paper but could be creating frustrated customers and repeat callers.
The real goal isn't just to be fast; it's to be effective. One agent who thoughtfully resolves a complex problem in a single call is infinitely more valuable than an agent who churns through three quick, unresolved contacts.
Common efficiency KPIs include:
- Average Handle Time (AHT): This is the total time spent on a customer interaction, from the moment the agent answers to the completion of any after-call work.
- Agent Utilization Rate: This shows you what percentage of an agent's paid time is spent on call-related activities versus being idle or on breaks.
- Adherence to Schedule: Simply put, this measures how well agents stick to their shifts, including their scheduled start times, breaks, and log-off times.
Pillar 3: Operational Health KPIs
While agent KPIs focus on the individual, operational KPIs give you that 10,000-foot view of your entire call center's health. Think of these as the vital signs of your operation. They help you spot system-wide bottlenecks, manage staffing levels effectively, and ensure you’re prepared for incoming customer demand.
For a more detailed look into this area, you can learn more about choosing the right contact center KPIs to match your business objectives.
Pillar 4: Financial KPIs
At the end of the day, a call center has to make financial sense. These KPIs are crucial because they tie your operational performance directly to the company's bottom line. They are the metrics you bring to the executive table to justify your budget, prove your value, and make the case for new technology or staffing.
Key financial metrics include:
- Cost Per Call (CPC): A straightforward calculation: your total operational costs divided by the total number of calls handled. This tells you exactly how much each interaction is costing the business.
- Revenue Per Call: Essential for any sales-focused contact center, this tracks the average revenue generated from each customer conversation.
Mastering The Most Important Call Center KPIs

Alright, you've got the basics down on what call center metrics are. Now it's time to roll up our sleeves and get practical. Let's move from theory to the individual KPIs that actually move the needle.
These are the numbers every manager should know like the back of their hand because they form the foundation of any solid performance strategy. Once you can confidently calculate and, more importantly, interpret these key metrics, you’ll shift from just watching the numbers to actively managing for results.
So, let's dive into the essential https://cloud-call-center.ae/2025/08/21/kpis-for-call-centers/ that truly deserve your focus.
First Call Resolution (FCR)
If there's one "powerhouse" KPI to rule them all, it’s First Call Resolution (FCR). This metric tells you what percentage of customer problems get solved on the very first try—no follow-ups, no transfers, no escalations needed.
Think of it as the ultimate blend of efficiency and customer happiness. A high FCR means happy customers who got their issue fixed fast, and that’s a massive win for loyalty. It also means your agents aren't getting bogged down with the same problem over and over again, freeing them up for the next customer.
Calculation:
(Total Resolved Incidents on the First Call / Total Number of Incidents) x 100
Globally, a good FCR benchmark hovers between 70% and 75%. For call centers in the UAE, a strong FCR is crucial for maintaining high Service Level Performance. The link is direct and powerful: when FCR goes up by just 1%, customer satisfaction often follows with a 1% increase. It’s clear proof that solving problems quickly keeps customers happy.
Average Handle Time (AHT)
Average Handle Time (AHT) is one of the most common—and commonly misunderstood—KPIs in the call center world. It tracks the average length of a customer interaction, from the moment an agent picks up the phone until they've wrapped up all their after-call work for that interaction.
Here's the key: the goal isn't just to make AHT as short as possible. Forcing agents to rush can backfire spectacularly, leading to unresolved issues, a tanking FCR, and seriously unhappy customers. Instead, you should view AHT as a diagnostic tool.
Calculation:
(Total Talk Time + Total Hold Time + Total After-Call Work) / Total Number of Calls
Is your team's AHT suddenly spiking? It could be a signal of a complex new product issue or a gap in your team's training. On the flip side, an agent with an unusually low AHT might be cutting corners. When you look at AHT alongside quality scores, you get the real story about an agent's efficiency and where they might need more support.
Customer Satisfaction (CSAT)
While metrics like FCR and AHT give you a window into your operations, Customer Satisfaction (CSAT) tells you exactly how your customers feel about the service they received. It’s a snapshot in time, usually captured with a quick post-call survey asking something simple like, "How satisfied were you with your recent interaction?"
Customers respond on a scale (like 1-5), and the score gives you an immediate pulse check on the quality of that specific call.
Calculation:
(Number of Satisfied Customers [e.g., scores 4-5] / Total Number of Survey Responses) x 100
The power of CSAT lies in its direct feedback. Imagine a telecom provider notices its CSAT scores are dipping. By digging in and comparing that data with their FCR numbers, they might discover the drop is tied to unresolved billing questions. That’s a clear signal to beef up agent training on that specific topic.
Net Promoter Score (NPS)
Where CSAT measures satisfaction with a single interaction, Net Promoter Score (NPS) zooms out to measure a customer's overall loyalty to your brand. It’s about the relationship, not just the transaction, and it helps you see the long-term health of your customer base.
NPS is famously calculated with one simple but powerful question: "On a scale of 0-10, how likely are you to recommend our company to a friend or colleague?"
Responses sort customers into three distinct groups:
- Promoters (Score 9-10): These are your brand champions, your most loyal fans.
- Passives (Score 7-8): They're satisfied for now, but not loyal enough to resist a competitor's offer.
- Detractors (Score 0-6): Unhappy customers who can actively harm your brand with negative word-of-mouth.
Calculation:
Percentage of Promoters – Percentage of Detractors
A positive NPS means you have more advocates than critics—a strong predictor of future growth. Loyal customers stick around longer, spend more, and bring new business your way. Tracking NPS helps you see the big-picture impact of the service you provide.
Solving the Cost Per Call Dilemma

If you've ever managed a call center, you know the daily tightrope walk between keeping costs in check and delivering fantastic customer service. This classic challenge is captured perfectly by one critical number: Cost Per Call (CPC).
This KPI gives you a brutally honest look at your operational spending. It answers a simple, yet powerful question: how much, exactly, does it cost us to handle a single customer call?
Think of CPC as a health check for your operation's efficiency. A high number can be a red flag, pointing to clunky processes, undertrained agents, or outdated tech. On the flip side, a healthy, optimized CPC is a clear sign that you’re running a tight ship—managing resources well and delivering value without breaking the bank.
Calculating Your True Cost Per Call
Getting an accurate CPC means looking beyond the obvious and accounting for every single expense that keeps your contact center running. The formula itself is simple, but its accuracy hinges on how thorough you are.
Calculation:
Total Operational Costs / Total Number of Calls Handled
So, what falls under the umbrella of "Total Operational Costs"? It's a blend of direct and indirect expenses that are all essential.
- Labor Costs: This is almost always the biggest piece of the pie. It includes agent salaries, supervisor wages, benefits, and any performance-based bonuses.
- Technology and Infrastructure: Think about all the tools you use daily. This covers software licenses for your contact center platform, CRM systems, phone line charges, and any hardware maintenance.
- Overhead Costs: Don't overlook the basics. This includes facility expenses like rent, utilities, and office supplies that support your team.
Once you add all of that up and divide it by the total calls you handled in a given period (like a month), you have your CPC. This figure is more than just a metric; it's a vital benchmark for the financial health of your entire customer service operation.
Smart Strategies to Optimize CPC
The gut reaction to a high CPC is often to just start cutting costs. While tempting, this can easily backfire, leading to longer queues, frustrated customers, and burned-out agents. The smarter move is to focus on boosting efficiency, not just slashing the budget.
In a competitive market, finding that balance is everything. This often means strategically using automation and self-service to handle the simpler queries, freeing up your human agents for the tough stuff. While outbound calling is still a major player—used by 63% of sales reps globally—the trend is to pair it with tech that makes every call more effective and less costly.
Here are a few proven strategies to get you started:
- Empower Customers with Self-Service: A well-built Interactive Voice Response (IVR) system or a detailed online knowledge base can deflect a huge number of basic, repetitive questions. When customers can solve their own problems, your agents are free to tackle more complex issues.
- Invest in Agent Training: Chasing the lowest possible CPC is a fool's errand. A small, ongoing investment in training pays for itself many times over. Well-trained agents resolve issues faster, which directly improves First Call Resolution (FCR) and cuts down on expensive repeat calls. It’s a true win-win: happier customers and lower long-term costs.
- Analyze Your Call Drivers: You have to know why people are calling. Dig into your data. If you discover that 20% of your calls are about the exact same simple billing question, that’s a massive opportunity. You can build a self-service solution or create a proactive communication campaign to get ahead of it.
While improving internal processes is crucial, a holistic approach also involves understanding how to track inbound phone calls from marketing efforts. This helps you see the full picture, including the cost to acquire that customer interaction in the first place.
Ultimately, managing CPC isn't about hitting the lowest number possible. It's about finding that perfect sweet spot where operational efficiency and an excellent customer experience can coexist.
Putting Your KPI Strategy into Action
Knowing your KPIs is one thing, but actually using them to make a difference is where the real work begins. The goal is to move beyond just collecting numbers and start using that data to shape agent performance, boost customer happiness, and streamline your entire operation. This isn't just about data; it's about a clear plan and the right mindset.
Ultimately, you want to turn raw data into a practical roadmap. A solid strategy connects every metric you track directly to a business outcome, making sure your data is always working for you.
Setting Realistic Targets and Choosing Your Tools
The first step is setting goals that are both clear and achievable. "Improve CSAT" is a wish, not a target. A much better goal is, "Boost our CSAT score from 80% to 85% this quarter by cutting AHT on our tech support calls." See the difference? Now your team knows exactly what they're aiming for.
Once you have your targets, you need the right tools to track your progress without drowning in spreadsheets. Modern contact center software is a game-changer here. It automatically gathers and analyzes every key KPI in a call center, from Average Handle Time to First Call Resolution, giving you a live look at performance.
When choosing a platform, look for a few key features:
- Automated Reporting: This saves countless hours and cuts down on human error.
- Customizable Dashboards: Lets you focus on the metrics that are most important to your team.
- CRM Integration: Gives you the full picture by connecting call data with customer history.
Building Insightful Performance Dashboards
Think of your dashboard as your command center. It takes all that raw data and turns it into a clear, visual story. A great dashboard helps you spot trends, flag issues, and keep a finger on the pulse of your operation, all in real time.
For the best results, structure your dashboards logically. You might have a high-level view for executives that shows big-picture metrics like overall CSAT and Cost Per Call. Team supervisors, however, need a more granular view—something that drills down into agent adherence, calls handled, and FCR rates for their specific group.
The point of a dashboard isn’t just to show you numbers; it's to help you answer important questions fast. If you can't figure out what your dashboard is telling you in 30 seconds, it’s too complicated.
This visual approach makes it so much easier to connect the dots. For example, if you notice a sudden drop in CSAT, you can immediately check it against AHT and FCR on the same screen to figure out what’s going on.
Using Data for Coaching, Not Criticism
This might be the most important shift you can make: use KPI data to coach your agents, not to punish them. When an agent’s AHT is creeping up, the first reaction shouldn’t be a warning. It should be a conversation. Are they getting stuck on new, complex calls? Do they need a refresher on a certain product?
This creates a culture of improvement, not one of fear. When agents view KPIs as a tool for their own growth, they become more invested in their performance. Consistent, data-driven coaching is the bedrock of any top-tier team. And to make sure that coaching pays off, it’s crucial to understand how to measure training effectiveness and leverage relevant KPIs.
This coaching-first mindset is also a key part of any solid quality assurance program. To learn more, check out our guide on building an effective https://cloud-call-center.ae/2025/06/13/contact-center-quality-assurance/. When you focus on developing your people, you empower them to own their performance and drive the entire center forward.
Answering Your Top Call Center KPI Questions
Once you start digging into the data, you’re bound to have questions. It's completely normal. Making sense of call center metrics can feel a little overwhelming at first, but it gets much simpler when you anchor everything back to what you're trying to achieve as a business.
Let's walk through some of the most common questions managers ask when they start putting their KPI strategy into practice. Think of this as a quick-reference guide to clear up confusion and help you navigate the day-to-day challenges with more confidence.
Which Single KPI Is the Most Important?
This is the classic question, but there's no single "magic bullet" KPI. The most important metric is always the one that’s most closely tied to your current business goals.
However, if I had to pick one that comes closest, it would be First Call Resolution (FCR). Why? Because FCR is a powerful indicator of two critical things at once: customer happiness and operational efficiency. When your FCR is high, it means customers are getting their problems solved on the first try, and your agents aren't getting bogged down with repeat calls about the same issue. It's a win-win.
For a truly complete picture, though, you need a 'balanced scorecard' approach that looks at 3-5 core KPIs. A great starting mix usually covers:
- Customer Experience: FCR and CSAT tell you how happy your customers are.
- Agent Efficiency: AHT gives you a window into individual productivity.
- Operational Health: Service Level shows if you're keeping up with incoming demand.
How Often Should We Review Our KPIs?
The right review cadence really depends on what the metric is telling you. You definitely don’t need to obsess over every single number every single day.
Metrics that reflect what's happening right now—like Service Level and Calls in Queue—need to be monitored continuously on live dashboards. These are your operational pulse. For agent-specific metrics like Average Handle Time (AHT), a daily or weekly review is perfect for spotting coaching opportunities without micromanaging.
Then you have your bigger picture KPIs, like Net Promoter Score (NPS) and Customer Satisfaction (CSAT). Since these measure overall sentiment and trends, analyzing them weekly or monthly gives you a much more meaningful view. Finally, you should plan a full strategic review of all your KPIs against your business goals every quarter. This is your chance to step back and make sure your targets and strategies still make sense.
Think of it like driving a car. You glance at your speedometer (real-time KPIs) constantly, check your fuel gauge (weekly trends) periodically, and get a full engine diagnostic (quarterly review) to ensure long-term health.
Can Focusing Too Much on AHT Hurt Customer Service?
Yes, absolutely. This is one of the most common traps call centers fall into.
When you pressure agents to cut down their Average Handle Time (AHT) above all else, they'll naturally start rushing conversations. This well-intentioned goal often backfires, leading to unresolved issues, frustrated customers, and a tanking FCR rate.
AHT is best used as a diagnostic tool, not a weapon. An unusually high AHT might signal that an agent is dealing with a really complex customer problem, that there's a new issue with a product, or that they simply need more training in a specific area. The smart way to use it is to look at it alongside your quality metrics. A low AHT paired with high FCR and CSAT is fantastic—that’s true efficiency. But a low AHT with poor quality scores? That’s a huge red flag.
What Is the Real Difference Between a Metric and a KPI?
I get this question all the time, and it's a fair point of confusion. The distinction is actually pretty simple.
Here’s the easiest way to think about it: a metric is just a number. It's any piece of data you can measure, like the total number of calls your team handled today. A KPI (Key Performance Indicator), on the other hand, is a metric you’ve specifically chosen because it shows how you’re performing against a critical business goal.
For example, 'total calls answered' is a metric. But your 'First Call Resolution rate' is a KPI in a call center because it's directly tied to the key objective of resolving customer issues efficiently and effectively. In short, all KPIs are metrics, but only the most important metrics that are aligned with your goals earn the title of KPI.
Ready to transform your customer interactions with a solution that simplifies KPI tracking and boosts performance? Cloud Move offers customized, unified communications that integrate seamlessly with your CRM, providing clear analytics and real-time dashboards to drive your success. To see how we can help you achieve your goals, request a free demo.