


A customer satisfaction index, or CSI, isn't just another survey. Think of it as a standardized framework—a structured system designed to measure how happy customers are with what you offer. The real value lies in its ability to collect consistent data and boil it all down to a single, trackable score.
Structuring Your Customer Satisfaction Index

If you want reliable business intelligence, you need a consistent format for your CSI. Without a defined structure, your data is all over the place. It becomes nearly impossible to benchmark your performance or pull out any genuinely useful insights. A thoughtfully designed format ensures every piece of feedback helps build a clear, measurable picture of customer sentiment.
From my experience, a successful CSI is built on three essential pillars:
- Perceived Quality: This is all about how your customers judge the reliability and performance of your product or service. Does it do what it's supposed to do, and do it well?
- Customer Expectations: Here, you're measuring the gap between what customers thought they were getting and what they actually experienced.
- Perceived Value: This one is simple but critical: Do customers feel the price they paid was justified by the benefits they received?
When you organize your index around these core components, you create a solid foundation. This structure is what allows you to get meaningful results that can actually improve your customer relationships.
Building Your CSI with Core Measurement Categories
A truly effective Customer Satisfaction Index isn't just a single, generic score. It's a carefully constructed framework built on distinct measurement categories that give you a complete picture of your customer's experience. When you organize your feedback this way, you get data that’s not just interesting—it’s actionable.
At the heart of any solid CSI are three critical components:
- Overall Satisfaction: This is the high-level pulse check. It captures the customer's general feeling about their entire journey with your brand.
- Attribute-Specific Satisfaction: Here's where you get into the nitty-gritty. This part drills down into tangible elements like product quality, the ease of your checkout process, or the responsiveness of your support team.
- Loyalty Metrics: These are forward-looking indicators. They help you predict future customer behavior, like their likelihood to make another purchase or recommend you to others.
Let's break these down into a more structured view.
Core Components of a CSI Framework
Here’s a quick summary of the primary categories you'll want to measure in a standard CSI, along with some practical examples of what those metrics might look like.
| Category | What It Measures | Example Metric |
|---|---|---|
| Overall Satisfaction | The customer's general sentiment and happiness with the brand as a whole. | "On a scale of 1-10, how satisfied are you with our company?" |
| Attribute Satisfaction | Performance of specific touchpoints, products, or service interactions. | "How would you rate the quality of the product you received?" |
| Loyalty & Intent | The likelihood of future positive actions and long-term engagement. | "How likely are you to recommend us to a friend or colleague?" (NPS) |
Having this kind of detailed breakdown is what separates a basic survey from a strategic business tool.
This approach lets you see exactly where you're excelling and where you're falling short. For instance, you might discover that while customers love your product, the delivery experience is a major pain point.
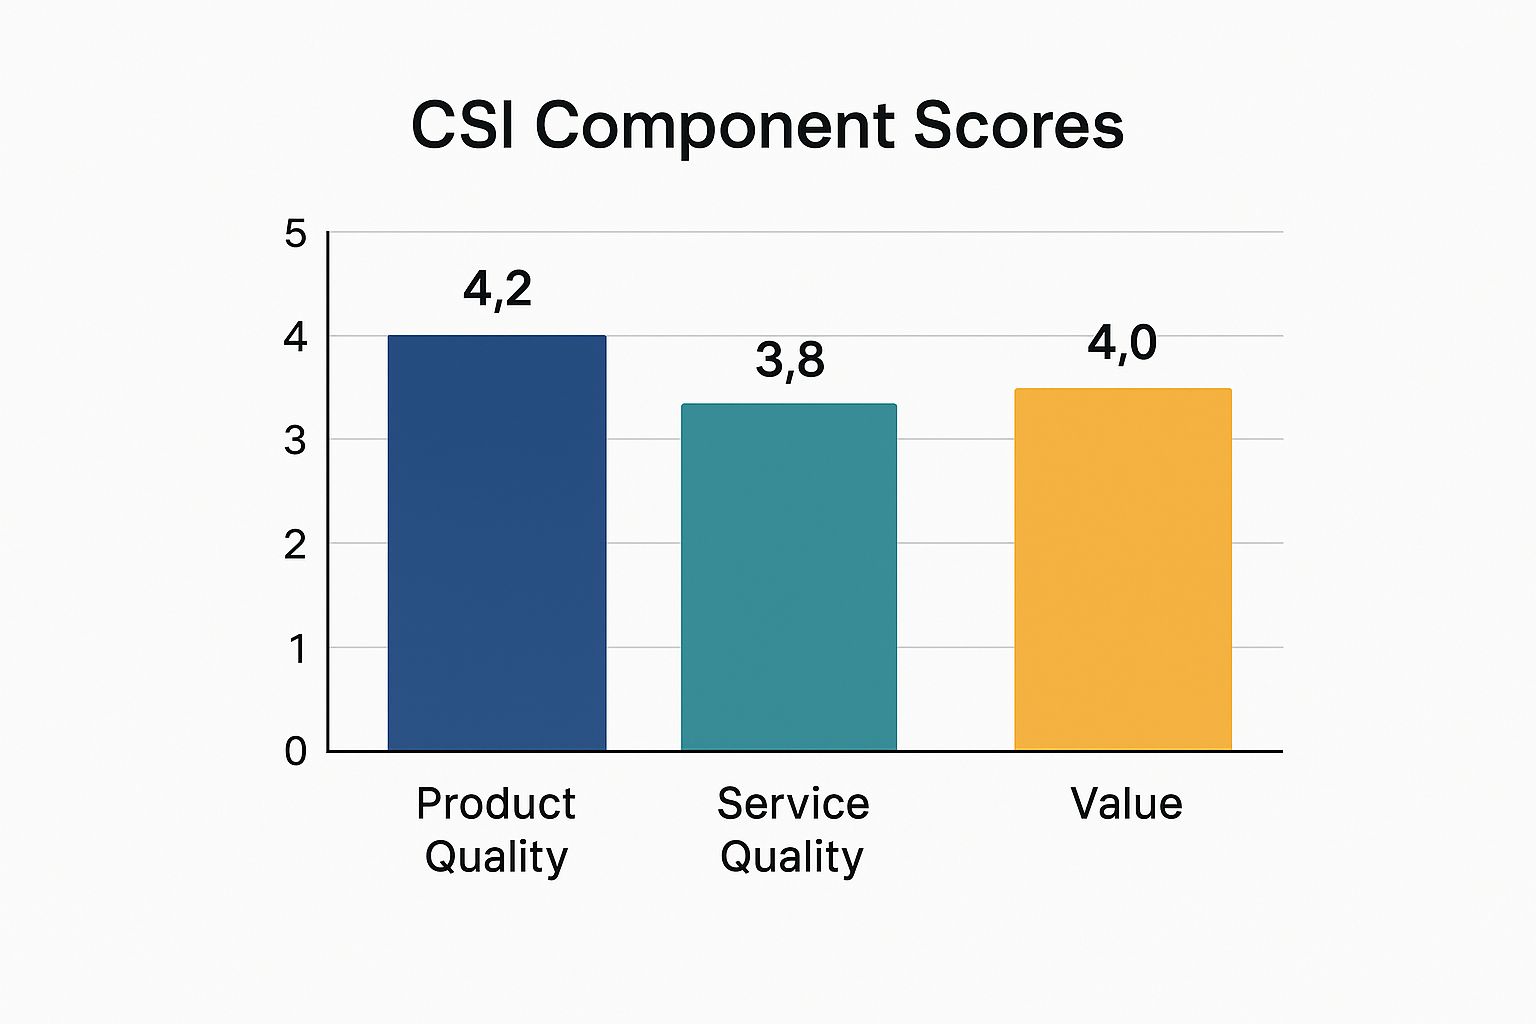
The data in the image above is a perfect example. It clearly shows that while product quality is a strength, service quality is an area that needs immediate attention. Digging into these specific attributes is crucial, much like how you would track specific key performance indicators for call centers. It’s this level of detail that turns raw data into a clear roadmap for improvement.
Defining Product and Service Quality Metrics

To get a true measure of satisfaction, your customer satisfaction index has to move beyond the vague idea of 'quality' and into specific, measurable components. Let’s face it, abstract concepts like "good service" don't give you anything to work with. You need granular data to make real improvements.
This means you’ll need to create distinct metrics for your products and services, because what defines quality for each is fundamentally different.
Key Product Quality Metrics
When you’re asking about a physical or digital product, the questions should zero in on tangible attributes that shape the user’s actual experience. Think about what they touch, see, and interact with day-to-day.
Here are a few core examples:
- Reliability: "On a scale of 1 to 10, how reliable has our product been?"
- Features: "How satisfied are you with the features available?"
- Ease of Use: "Please rate the ease of using our product."
On the other hand, service quality is all about the human element and the smoothness of the process. Your metrics here need to capture how customers perceive the competence and support they received. This is how your CSI gets you feedback you can actually act on.
Measuring the Gap Between Expectation and Value
At its core, true customer satisfaction is all about one thing: the gap between what a customer expected and what they believe they received. A solid customer satisfaction index has to get a real number on that difference.
It all starts with setting a baseline. Before a purchase or right at the beginning of an interaction, you need to gauge their expectations. What did they think they were going to get from your product or service?
Once they've had the experience, you follow up to measure their perception of how it actually went. The magic happens when you directly compare that "reality" score to their initial expectation. To get the full picture, you should also throw in questions about perceived value—things like whether the price felt fair or how your offering stacks up against the competition.
Understanding this gap isn't just an academic exercise; it gives you a clear roadmap for what to fix. You can learn more about different approaches in our guide to measuring customer satisfaction. When you can pinpoint and close that expectation-to-value gap, you're on the direct path to better retention and genuine customer loyalty.
Integrating Loyalty Metrics Like NPS and CES

To get the full picture of customer health, your customer satisfaction index format has to go beyond basic satisfaction scores. It's crucial to fold in forward-looking loyalty metrics like the Net Promoter Score (NPS) and Customer Effort Score (CES).
These aren't just satisfaction ratings; they are powerful indicators that help predict future customer behavior. NPS, for example, measures a customer's willingness to recommend your brand, while CES tells you how easy it was for them to get a problem solved.
Think of NPS as a direct line to predicting growth and spotting potential churn. It asks the ultimate question: "How likely are you to recommend us?" This has real-world implications, especially in regions like the Middle East. A 2022 survey of 3,000 mobile users across the UAE and neighboring countries revealed a clear link between high NPS scores and significantly lower churn rates.
If you're looking for a practical way to start measuring this, a good Net Promoter Score (NPS) survey template is an excellent resource.
By weaving these loyalty-focused questions into your index, your CSI stops being just a report card on past performance. It becomes a predictive tool that empowers you to proactively identify at-risk customers and step in before it's too late.
Weaving Trust and Security into Your CSI
In a world where almost every transaction happens online, a great product isn't enough. If your customers don't feel their data is safe with you, they'll walk away. That's why any modern Customer Satisfaction Index has to treat trust and security as foundational pillars, not just afterthoughts.
This means moving past the usual questions about product quality or service speed. Instead, you need to directly ask customers how much they trust you to handle their information responsibly and secure their transactions. These aren't just feel-good metrics; they're essential indicators of your brand's integrity and a core part of any robust customer experience management framework.
The numbers back this up. A 2023 report revealed a striking statistic: 84% of consumers say they value privacy and security more than an easy checkout process. This makes trust a massive competitive advantage. For more on this, check out this piece on balancing innovation and customer trust.
How to Adapt the CSI for Digital Business Models
When you're running a digital business, a generic customer satisfaction index just won't cut it. The truth is, the way customers interact with an e-commerce store versus a subscription service is fundamentally different, and your CSI needs to reflect that reality.
If you're in e-commerce, your focus should be squarely on the transactional experience. Think about the friction points: How easy is your website to navigate? Is the checkout process a breeze or a chore? And what about the final moment of truth—delivery speed and accuracy? These are the moments that make or break satisfaction for an online shopper.
Subscription models, on the other hand, play a much longer game. For these businesses, the key is to measure the ongoing value customers feel they're receiving. Your CSI should dig into things like the ease of managing an account, the clarity of your billing, and whether the service consistently delivers on its promise. Here, convenience and cost-effectiveness are often the primary drivers of loyalty.
This is especially critical in markets like the Middle East, where consumer habits are unique. A staggering 32% of consumers there use subscription services, which is nearly double the global average. When you look closer, over 50% of them point to convenience and cost-effectiveness as their main reasons for signing up. As research from PwC highlights, understanding these motivations is essential to crafting a relevant CSI.
Key Takeaway: To get meaningful data, you have to customize your CSI to the specific journey your customers take. An e-commerce business needs to obsess over transaction efficiency, while a subscription service must constantly evaluate the long-term value it provides.
Common Questions About the Customer Satisfaction Index Format
When you start digging into the details of a Customer Satisfaction Index, a few practical questions almost always come up. Nailing down the structure and timing is key if you want to collect data that actually helps you improve the customer experience.
What's the Best Length for a CSI Survey?
So, how long should a CSI survey be? You're walking a fine line here—you need to be thorough, but you can't risk your customers getting tired and abandoning the survey.
A good rule of thumb is to aim for a survey that someone can complete in 5-7 minutes. This usually translates to about 15-25 questions. Be ruthless about which questions you include; stick to the ones that will give you the most actionable feedback. You can also use conditional logic to ensure customers only see questions that are relevant to their specific journey.
How Often Should We Measure CSI?
This is a classic "it depends" situation. The right frequency for measuring your CSI really comes down to your business model.
If you run a transactional business, like an e-commerce store, it makes a lot of sense to send a survey after key interactions, like a purchase or a support ticket resolution. For businesses built on long-term relationships, such as a SaaS platform, a quarterly or even bi-annual survey might be a better fit. The most important thing is consistency, as that’s what allows you to track trends accurately over time.
How Is the Overall CSI Score Calculated?
Calculating the final CSI score is a multi-step process that results in a weighted average. It’s not just a simple average of all your survey responses.
Here’s how it works:
- First, you calculate the average score for each individual component you're measuring (e.g., product quality, customer support, perceived value).
- Next, you assign a weight to each of those components based on how important it is to your customers. You might determine these weights through separate research or by asking a direct question in the survey.
- Finally, you multiply each component's average score by its assigned weight and add up all the results. This gives you a single indexed score, typically on a 0-100 scale, that reflects your overall customer satisfaction.
Ready to bring all your customer communications into one place and get a clearer view of your performance? Cloud Move offers customizable contact center solutions that integrate smoothly with your CRM. Find out how we can help you boost customer satisfaction by requesting a free demo today.