Running a call center without Key Performance Indicators (KPIs) is like trying to fly a plane without an instrument panel. You can feel the turbulence and hear the engines, but you have no real data to guide you to a safe landing. KPIs are your instruments, turning operational noise into clear, actionable intelligence that guides your strategy.
They give you the visibility you need to steer your team toward success. Think of it as a command center for your entire operation. Each KPI is a vital gauge on your dashboard, offering real-time feedback on everything from agent productivity to customer happiness. Without these metrics, you’re flying blind, only realizing there's a problem when it's already a full-blown crisis.
The Core Pillars of Performance
To get a complete picture, you need to look at your performance from a few different angles. A truly effective KPI strategy doesn't just measure one thing, like how fast calls are answered, at the expense of another, like the quality of the resolution. Every important metric falls into one of three core categories.
- Customer Experience: These KPIs measure how your customers feel about their interactions. Are they satisfied? Is their problem solved?
- Operational Efficiency: This is all about how smoothly and cost-effectively your center runs. Are your processes streamlined or are they creating friction?
- Agent Performance: These metrics zoom in on the productivity and effectiveness of your individual team members and the team as a whole.
This structured approach ensures you maintain a healthy balance. After all, what good is a fast answer time if the customer has to call back three more times?
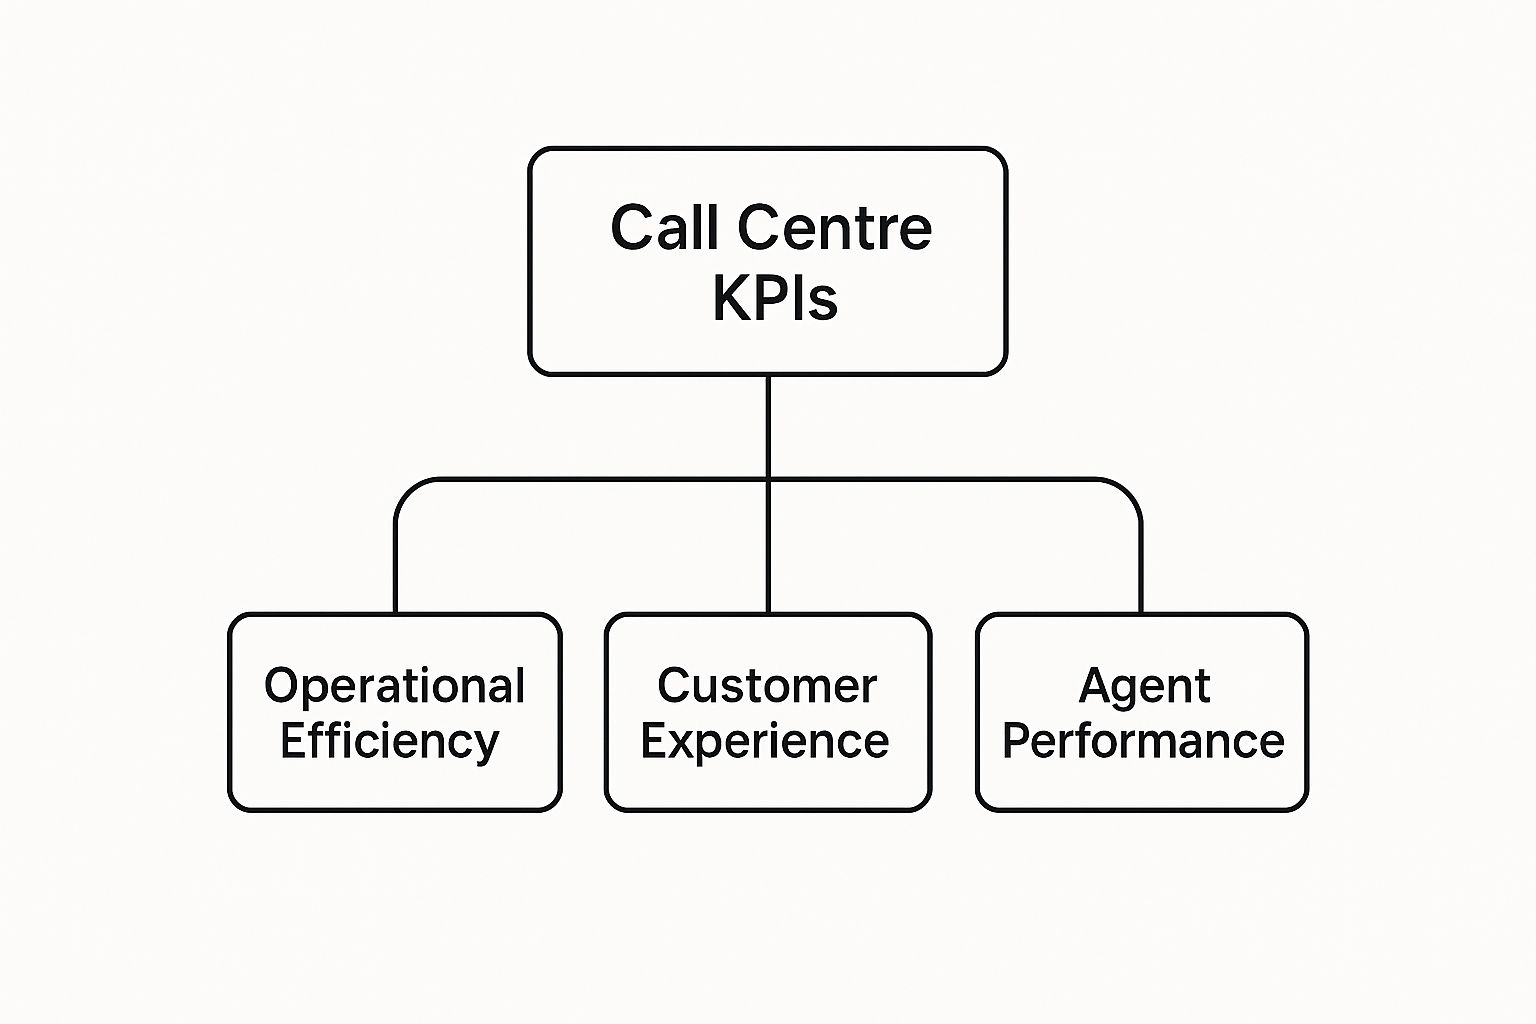
The image above really drives home how these pillars support each other. Focusing on just one area gives you a dangerously incomplete view of your call center's overall health. Visualizing this data is key, which is where a well-designed https://cloud-call-center.ae/2025/05/19/call-center-reporting-dashboard/ becomes invaluable.
To simplify this, here’s a quick breakdown of what each category aims to tell you.
Your Quick Guide to Essential KPI Categories
This table provides a high-level summary of the main KPI categories and the core question each one helps you answer.
| KPI Category | The Core Question It Answers | Example Metrics |
|---|---|---|
| Customer Experience | How happy are our customers with our service? | Customer Satisfaction (CSAT), Net Promoter Score (NPS), First Call Resolution (FCR) |
| Operational Efficiency | How productive and cost-effective is our operation? | Average Handle Time (AHT), Cost Per Call, Agent Utilization |
| Agent Performance | How effective are our agents at their jobs? | Calls Handled, Adherence to Schedule, Quality Assurance (QA) Scores |
As you can see, each category answers a fundamental business question, giving you a 360-degree view of your operations.
Turning Data Into Decisions
In a service-driven market like the UAE, keeping a close eye on KPIs is non-negotiable. Top-performing contact centers in the region consistently benchmark key metrics. For instance, a common Service Level goal is to answer 80% of calls within 20 to 30 seconds—a standard set by high customer expectations.
A well-chosen set of KPIs does more than just measure performance; it aligns your entire team around common goals, drives accountability, and provides the objective insights needed for strategic decision-making.
Ultimately, the goal is to move beyond just watching numbers on a screen. By analyzing trends in your KPIs, you can pinpoint exactly where more training is needed, find opportunities to optimize workflows, and build a solid case for new resources. To dig deeper into the specific metrics you should be tracking, exploring these essential customer support KPIs is a great next step. This foundational knowledge is what transforms day-to-day interactions into long-term business growth.
Measuring What Matters Most to Customers
While operational metrics are the engine that keeps your call center running, another set of KPIs tells you something far more important: how your customers actually feel. These are the numbers that reveal the true story behind your service quality.
They shift the focus from pure efficiency to the human experience at the core of every single interaction. Think of these customer-centric KPIs as different lenses. Each one offers a unique angle, helping you build a complete picture of the customer journey and highlighting moments of both frustration and delight.
Gauging Immediate Happiness with CSAT
The most straightforward way to take the temperature of a customer's feelings right after an interaction is with the Customer Satisfaction Score (CSAT). This metric is all about capturing that immediate, in-the-moment reaction to a specific experience, like a phone call or a chat session.
You’ve probably seen it before. It’s usually a simple question like, "How satisfied were you with your support today?" Customers then rate their experience on a scale, typically 1-5 or 1-10.
A high CSAT score tells you that your agents are hitting the mark and meeting customer needs right then and there. It’s a tactical tool that gives you fast feedback on individual performance and how well specific issues were handled.
Imagine a customer calls because their online order showed up with the wrong item. The agent quickly sorts it out, arranging a replacement and an easy return. A CSAT survey sent right after gets a 5/5. That’s instant, actionable proof that the agent handled that particular problem perfectly.
Predicting Long-Term Loyalty with NPS
While CSAT is about the "here and now," the Net Promoter Score (NPS) zooms out to measure the big picture: overall brand loyalty. It’s not about one phone call; it’s about the customer’s entire relationship with your company.
NPS is famously derived from a single, powerful question: "On a scale of 0-10, how likely are you to recommend our company to a friend or colleague?"
Based on their answers, customers fall into three distinct camps:
- Promoters (Score 9-10): Your biggest fans. They’re loyal, they keep buying, and they’ll sing your praises to others.
- Passives (Score 7-8): They’re satisfied, but not wowed. They could easily be swayed by a competitor’s offer.
- Detractors (Score 0-6): Unhappy campers. These customers can actively harm your brand with negative word-of-mouth.
You calculate your final NPS by subtracting the percentage of Detractors from the percentage of Promoters. The resulting score gives you a high-level snapshot of customer sentiment and is a surprisingly strong predictor of future growth.
Understanding the Ease of Service with CES
The third piece of this puzzle is the Customer Effort Score (CES). This KPI zeroes in on an equally critical, yet often overlooked, aspect of the experience: how easy was it for the customer to get their problem solved?
Study after study shows that making things easy for customers is one of the biggest drivers of loyalty.
CES poses a question like, "How easy was it to get your issue resolved today?" with answers ranging from "Very Difficult" to "Very Easy."
Let’s go back to our customer with the wrong order. Even if the agent who finally helped was fantastic, what if that customer first had to navigate a confusing phone menu, wait on hold for 20 minutes, and get transferred twice? Their effort score would be terrible.
This is what makes CES so insightful. It uncovers the friction points in your processes that wear customers down and push them away. A great CES score is a sign that your systems are truly built around the customer, making every interaction feel seamless.
Each of these KPIs provides a vital piece of the puzzle. For a deeper look at putting these surveys into practice and analyzing the results, check out our guide on measuring customer satisfaction. By tracking CSAT, NPS, and CES in tandem, you get a rich, three-dimensional view of the customer experience, allowing you to fix today’s problems while building tomorrow’s loyalty.
Driving Peak Operational Efficiency
While customer-facing metrics tell you how happy your customers are, operational KPIs are all about the health and horsepower of your call center's engine. These are the numbers that reveal just how smoothly, quickly, and cost-effectively your team is really running. Think of them as the diagnostics for your entire operation, showing you precisely where to tune up processes for maximum performance.
A great call center manager is like a skilled mechanic looking at engine speed, oil pressure, and temperature. You have to monitor key efficiency metrics to run a lean, effective operation that serves customers without wasting resources or burning out agents. It's all about finding that perfect balance between speed and quality.
Decoding Average Handle Time
One of the most fundamental operational KPIs is Average Handle Time (AHT). This metric measures the entire lifespan of a customer interaction, from the moment it begins to the second it's fully resolved. It’s not just talk time; it’s a complete picture of the time invested in each contact.
AHT is typically broken down into three key parts:
- Total Talk Time: The actual time the agent spends speaking with the customer.
- Total Hold Time: Any period the customer is placed on hold during the call.
- Wrap-Up Time: The post-call work an agent does, like updating the CRM, logging notes, or sending follow-up emails, before they are ready for the next call.
But here’s a common trap: the goal isn't just to have the lowest AHT possible. Chasing a rock-bottom AHT can pressure agents to rush customers off the phone, leaving issues unresolved and leading to frustrating repeat calls. AHT is best used as a diagnostic tool. It can help you spot agents who need a bit more training or identify system bottlenecks that are causing long wrap-up times.
The Powerhouse Metric: First Call Resolution
If there's one operational KPI that packs a punch, it's First Call Resolution (FCR). This metric tracks the percentage of customer issues that are completely resolved during the very first interaction. No follow-up calls, no extra emails, no repeat chats—just a clean, one-and-done solution.
A high FCR is the ultimate win-win. Customers are delighted because their problems are solved quickly and effortlessly. Your call center becomes more efficient by eliminating the cost and agent time tied to repeat contacts.
Improving FCR is one of the most direct ways to boost both customer satisfaction and your bottom line. An issue solved on the first try prevents a second or third call, freeing up your team to handle new incoming queries. This single KPI has a powerful ripple effect across your entire operation.
The secret to a great FCR? Empowering your agents. This means giving them solid training, easy access to knowledge bases, and the authority to make decisions without needing a supervisor's approval for every little thing. When agents are well-equipped and trusted, they can solve problems on the spot.
A Comparison of Key Operational KPIs
To really get a handle on your operations, it's helpful to see how these core efficiency metrics stack up against each other. Each one tells a different part of the story, from the speed of individual interactions to the overall accessibility of your team.
| KPI | What It Really Measures | Industry Benchmark | The Ultimate Goal |
|---|---|---|---|
| Average Handle Time (AHT) | The total time investment per customer interaction (talk, hold, and wrap-up). | Around 6 minutes, but varies widely by industry. | Find the "sweet spot" where agents are efficient but not rushing customers. |
| First Call Resolution (FCR) | The percentage of issues solved completely on the first contact. | 70-75% is a common target. | Get as close to 100% as possible by empowering agents to solve problems. |
| Service Level | The percentage of calls answered within a set time threshold. | A classic goal is 80/20 (80% of calls answered in 20 seconds). | Consistently meet your target to minimize wait times and abandoned calls. |
Looking at these KPIs together gives you a much clearer picture of your operational health than any single metric could on its own.
Understanding Service Level Targets
Another crucial KPI for call center efficiency is your Service Level. This measures the percentage of calls answered within a specific, predetermined timeframe. You’ll often see it expressed as two numbers, like 80/20.
Think of it as a promise to your customers. An 80/20 service level means you're aiming to answer 80% of all incoming calls within 20 seconds. This target is a vital part of workforce management because it directly dictates how you staff your call center to meet expected call volumes.
If your service level starts to drop, it’s a clear signal that you don't have enough agents on deck, leading to longer queues and more abandoned calls. Maintaining a consistent service level requires sharp planning, which is where specialized workforce scheduling software for efficient planning becomes invaluable.
Here in the UAE, forecasting tools are often fine-tuned to account for local factors, like different payment gateway issues or unique peak traffic hours. By tailoring KPIs to these operational realities, local call centers can adjust staffing more effectively, reducing agent burnout and improving service delivery right where it counts.
Unlocking Your Team's Full Potential

While metrics focused on customers and operations give you the big picture, the real engine of your call center is your team. The KPIs that track agent performance aren't about micromanaging people. They’re about empowerment—giving your team the feedback, coaching, and support they need to truly shine.
When you get these metrics right, they become powerful tools. You can spot who needs a little extra training, step in to prevent burnout, and ultimately, hold onto your best people. Because at the end of the day, a motivated, well-supported team is what creates genuinely great customer service.
Maximizing Productive Time with Agent Utilization
One of the most revealing agent-focused metrics is Agent Utilization. It tells you exactly what percentage of an agent's paid time is spent on actual work-related activities. Think of it as a clear snapshot of your team's overall productivity.
It's easy to get this one confused with a similar metric, Occupancy, but the difference is critical.
- Occupancy is purely about the time an agent spends directly handling customer interactions—talking, hold, and after-call work—compared to their available time.
- Utilization is the whole enchilada. It includes all that customer-facing time plus other essential tasks like training sessions, team huddles, coaching, and answering emails.
Here's a simple way to think about it: Occupancy tells you how busy agents are on the phones. Utilization tells you how productive they are across their entire shift. Chasing 100% occupancy is a surefire way to burn out your team, but a healthy utilization rate—often around 80-85%—shows their time is being invested wisely.
This isn't just semantics. Pushing for sky-high occupancy ignores all the crucial activities that help agents improve and deliver better service down the line. Utilization gives you a far more balanced, sustainable, and realistic view of performance.
Ensuring Reliability with Schedule Adherence
Another vital KPI is Schedule Adherence. This one is simple: it measures how closely your agents stick to their assigned schedules. Are they logging in on time? Are they taking breaks and lunches as planned? It’s a direct measure of reliability and discipline.
While it might sound a bit like Big Brother, high schedule adherence is the bedrock of accurate staffing. When everyone sticks to the plan, you can confidently ensure you have the right number of agents ready to go, which keeps customer wait times down and service levels up.
If you see someone’s adherence rate consistently dipping, it’s often a flag for deeper issues. It could be a sign of low morale, unclear expectations, or even the first signs of burnout. The best approach isn't punitive; it's a supportive conversation to figure out what's really going on.
Coaching for Excellence with Quality Assurance
Perhaps the single most powerful tool for developing your agents is the Quality Assurance (QA) Score. This KPI involves reviewing agent-customer interactions and scoring them against a clear set of standards, from the accuracy of the information provided to the tone of voice used.
A great QA program is a coaching tool, not a report card. The goal is to deliver specific, constructive feedback that helps agents build their skills and their confidence.
A robust QA scorecard should cover a few key areas:
- Problem Resolution: Did the agent correctly diagnose the customer's issue and find the right solution?
- Communication Skills: Was the agent clear, empathetic, and professional throughout the call?
- Process Adherence: Did the agent follow all necessary security and documentation protocols?
- Customer Experience: Ultimately, did the agent make the customer feel valued and heard?
You can see the importance of agent performance in booming markets like the BPO sector in Africa, which already employs between 750,000 and 1.2 million people. In hubs like the UAE and neighboring countries, agents with multilingual skills are in high demand to serve a global customer base. In these centers, KPIs are evolving beyond the basics to track things like language proficiency and cultural awareness, ensuring a world-class customer experience. You can discover more insights about the growth of Africa's call center industry and its global impact.
Translating Performance Into Business Growth
Connecting your day-to-day operations to the company’s bottom line is how you transform your call center from a cost center into a strategic asset. When you can tie performance directly to financial outcomes, you start speaking the language of leadership. It’s the clearest way to prove your team’s value in a way that resonates across the entire organization.
These business-focused KPIs shift the conversation from simple operational efficiency to real, tangible growth. They answer the big questions: "How does our work actually impact revenue?" and "What is the return on our department's investment?" Getting a firm handle on these metrics is your key to securing budgets, justifying new resources, and proving your team’s strategic importance.
Measuring Financial Efficiency with Cost Per Contact
One of the most powerful business metrics you can track is Cost Per Contact. At its core, this KPI calculates the total expense of running your operation divided by the total number of contacts you handled in a given period. It gives you a clear, hard number for exactly how much each customer interaction costs the business.
To get this number, you'll need to add up all your operational costs—everything from agent salaries and benefits to software licenses, phone bills, and even your share of the office rent. A lower Cost Per Contact points to greater efficiency, showing that you’re managing your resources well while still serving customers effectively.
This single metric provides a powerful financial baseline. When you can show leadership that a new training program or technology investment directly lowered your Cost Per Contact, you’re making an undeniable case for your team's value.
Demonstrating Long-Term Value Through Customer Retention
Another absolutely critical KPI is the Customer Retention Rate. This metric tracks the percentage of customers who stick with your company over time. While it's often seen as a company-wide number, your call center has a massive influence on it.
Let's be honest: poor service is one of the top reasons customers leave. Every positive, efficient, and empathetic interaction your team has is a deposit in the customer loyalty bank. Tracking this rate helps you prove that your call center isn't just a problem-solving machine—it's actively protecting a vital revenue stream for the business.
Linking Service to Sales with Conversion Rate
For any call center involved in sales or upselling, the Sales Conversion Rate is non-negotiable. This KPI measures the percentage of customer calls that lead to a successful sale. It draws a straight line from your team’s efforts to revenue generation, leaving no doubt about your department’s contribution.
A healthy conversion rate shows that your agents are more than just service reps; they're skilled advisors who can guide customers to a purchasing decision. Ultimately, many call center KPIs are about translating great performance into business growth, often by implementing conversion rate optimization best practices.
Think about how you can connect these dots for your leadership team:
- Improving your First Call Resolution (FCR) by 10% means fewer frustrated customers calling back.
- This immediately lowers your Cost Per Contact because agents are handling each issue just once.
- Happier customers whose problems are solved on the first try are far more likely to stick around, boosting your Customer Retention Rate.
When you present this clear chain of cause and effect, you show that investing in agent training to improve FCR isn't just another expense. It’s a direct investment in the company's profitability and long-term health.
Using Technology to Supercharge Your KPI Strategy

Trying to track your call center KPIs manually these days is like navigating a megacity with a crumpled paper map. Sure, you might get there eventually, but it’s going to be slow, frustrating, and you’ll probably miss a few crucial turns. Modern tech completely changes the game, giving you real-time insights that let you stop putting out fires and start preventing them.
The right software, especially advanced Contact Center as a Service (CCaaS) platforms, offers a live, breathing picture of your entire operation. Instead of waiting for a report at the end of the week, you can see performance dip and spike in the moment, allowing you to make quick, smart adjustments right when they’re needed.
This shift toward smarter tech is fueling massive growth in the industry, especially in the Middle East & Africa (MEA). In 2024, the MEA CCaaS market was already valued at around USD 420.9 million and is expected to rocket to USD 1,122.9 million by 2032. This isn’t just about new gadgets; it’s about centers getting much better at measuring and acting on every key kpi for call centre performance, from customer happiness to call containment. You can explore more about these regional technology trends to see just how big the impact is.
The Rise of AI-Driven Analytics
Artificial intelligence (AI) is truly a game-changer for how we manage KPIs. It goes way beyond just counting things; it starts delivering predictive insights that tell you what’s likely to happen next. AI-powered tools can sift through thousands of call recordings, chat logs, and emails to automatically spot patterns in customer sentiment or pinpoint the exact moments where customers are getting stuck.
This opens up a whole new world for quality assurance. Think about it: most managers only have time to manually review a tiny sample of calls—maybe 1-2% at best. AI can analyze 100% of them.
AI isn’t just scoring calls based on a checklist. It's delivering objective, data-backed feedback on agent performance, highlighting specific skills that need coaching, all without the risk of human bias. It can even give agents helpful, in-the-moment prompts during a tough conversation.
Building a Proactive, Data-Centric Culture
At the end of the day, technology isn’t about replacing people. It’s about empowering them to take a smarter, more dynamic approach to managing the call center. It helps you build a culture where decisions are driven by solid data, not just gut feelings.
- Real-Time Dashboards: A supervisor can glance at a screen and see key metrics like service levels and active call queues, allowing them to shift agents around on the fly to handle a sudden rush.
- Predictive Insights: AI can look at historical data and upcoming events to forecast call volumes with surprising accuracy, helping you nail your staffing levels and avoid being caught off guard.
- Automated Reporting: This is a huge time-saver. By automating performance reports, you free up your managers to spend less time crunching numbers and more time coaching their teams.
When you integrate these kinds of tools, you’re not just making your operation more efficient—you’re sharpening the human element of customer service. You’re giving your team the information they need to be faster, smarter, and more effective. That’s a real competitive edge.
Answering Your Top Questions About Call Center KPIs
Alright, let's move from theory to practice. Once you start digging into call center metrics, a lot of practical questions pop up. Getting straight answers is key to building a strategy that actually works for your team.
Here are some of the most common questions managers ask when they start tracking and fine-tuning their call center KPIs.
Is There One "Magic" KPI to Rule Them All?
If I had to pick just one, it would be First Call Resolution (FCR). It's often the most powerful because when you get it right, everything else seems to fall into place. A high FCR means happier customers, lower costs (because you're not handling repeat calls), and a more efficient team. It's a triple win.
That said, the "most important" KPI really hinges on your specific goals. If you're running a sales-focused team, Conversion Rate is naturally going to be your north star. For a technical support desk, FCR and Customer Effort Score (CES) will tell you much more about your performance.
How Often Should We Be Looking at These Numbers?
You don't need to watch every metric like a hawk, but you can't just set them and forget them either. The trick is to create a rhythm for reviewing your KPIs.
Think of it in layers:
- Hourly: Your frontline supervisors need to be watching real-time metrics like Service Level and Average Speed of Answer. This is all about managing the immediate flow of calls and making sure you're hitting your service promises for that day.
- Daily/Weekly: Metrics like Schedule Adherence and Average Handle Time are perfect for daily huddles or weekly one-on-ones. They give agents and managers concrete talking points for coaching and improvement.
- Weekly/Monthly: The big-picture metrics like CSAT, NPS, and Customer Retention are best reviewed over longer stretches. This is where you'll spot the meaningful trends that tell you if your overall strategy is working.
As a rule of thumb, plan a deep dive into all your KPIs and their targets every quarter. This keeps your metrics aligned with bigger company goals and allows you to adjust as priorities shift.
Can We Focus Too Much on KPIs?
You absolutely can, and it's a common trap. When you get tunnel vision on a single metric, you can accidentally create some really unhelpful behaviors.
Here’s a classic example: If you push your agents too hard to lower their Average Handle Time (AHT), they might start rushing customers off the phone. Sure, the AHT numbers will look great, but you'll likely see your FCR plummet and your customer satisfaction scores take a nosedive as frustrated customers call back again and again.
The key is to always look at your metrics as a balanced set. Track AHT, but do it alongside FCR and CSAT. This gives you the full picture, ensuring that your quest for efficiency doesn't sabotage the quality of your service. Use KPIs as a guide for coaching, not a weapon.
At Cloud Move, we build modern contact center solutions that give you the reporting and analytics you need to track these KPIs without the guesswork. Our platform provides a single, clear view of your team's performance, so you can make smart, data-driven decisions that improve customer happiness and grow your business. See how our tools can sharpen your KPI strategy at https://cloud-call-center.ae.
