

When we talk about call center KPIs, or key performance indicators, we’re talking about the specific, measurable data points that tell us how well a customer service operation is actually performing. These aren't just abstract numbers; they're vital signs that give you a clear picture of everything from agent productivity to how happy your customers really are.
Think of them as your data-driven guide for making smarter decisions.
Why Call Center KPIs Are Your Compass for Success
Could you imagine trying to navigate a ship across the ocean without a compass? You’d be moving, sure, but you'd have no real idea if you were heading in the right direction. Running a call center without tracking the right KPIs is exactly like that. You're busy, but you have no way of knowing if all that activity is getting you closer to your goals.
These metrics are more than just figures on a dashboard; they’re your navigation system.
Just as a compass always points north, the right set of KPIs guides your strategic decisions, helping you steer your team toward better customer experiences and sharper operational efficiency. Instead of just guessing, you start to see the real story the data is telling—about your team's performance, your customers' satisfaction levels, and the direct impact you're having on the business.
A data-driven approach is critical for staying competitive. Mastering your KPIs is the first step toward fostering growth, boosting agent morale, and building unbreakable customer loyalty.
This kind of analytical mindset shifts your entire operation from being reactive to proactive. When you truly understand your key metrics, you can spot potential issues before they become major problems, allocate your resources more effectively, and continuously fine-tune your processes. For a deeper dive into how performance indicators work across different business models, this complete guide to SaaS KPIs is an excellent resource.
Ultimately, when you embrace KPIs, you stop seeing your call center as a cost center and start seeing it for what it is: a value-generating powerhouse. It gives you the insight needed to make informed choices that lead directly to tangible results, like:
- Elevated Customer Satisfaction: You can pinpoint exactly where customers are struggling and fix those issues.
- Improved Agent Performance: It becomes easy to identify coaching opportunities for struggling agents and celebrate your top performers.
- Enhanced Operational Efficiency: You can streamline workflows, cut down on wasted time, and reduce unnecessary costs.
By treating your KPIs as your compass, you ensure that every single action your team takes is a deliberate step toward achieving your most important business objectives.
The Three Pillars of Call Center Performance
If you want to get a real handle on your call center's performance, you can't just fixate on one number. A single metric only ever tells you a sliver of the story. To see the whole picture, you need to organize your KPIs for call centers into a clear, logical framework. This stops you from chasing one goal at the expense of another—like pushing for speed while customer happiness nosedives.
The best way I've found to structure these metrics is by grouping them into three distinct but deeply connected pillars. Think of them as the foundation of a solid, well-run operation. They give you a balanced view, ensuring no critical part of your performance gets ignored.
This infographic lays out the hierarchy perfectly, showing how essential KPIs build on each other to support a successful call center.
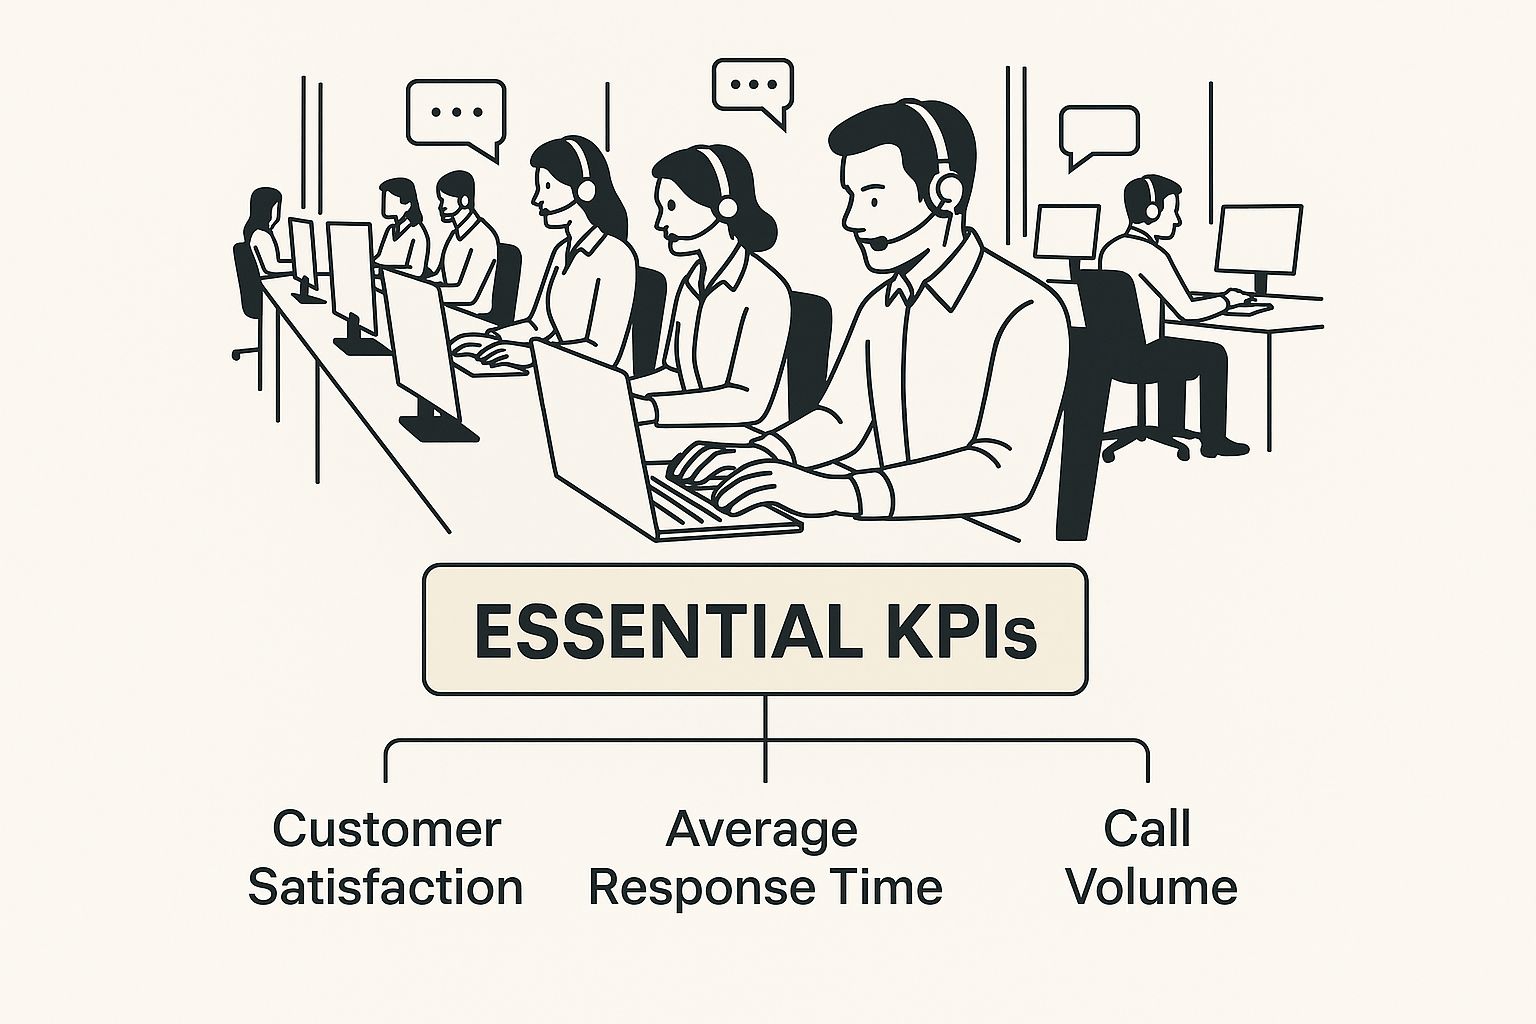
As you can see, a winning strategy pulls metrics from each of these core areas to drive overall success.
Pillar 1: Customer Experience
The first—and you could argue the most important—pillar is Customer Experience. These KPIs are all about measuring the quality of your service from the customer's point of view. Are they happy? Did we solve their problem quickly and completely? A great experience here builds loyalty and turns customers into your biggest fans.
Key metrics in this group include:
- Customer Satisfaction (CSAT): This is your direct pulse-check on how happy a customer is with a specific interaction, usually captured right after the call with a simple survey.
- Net Promoter Score (NPS): This one looks at the bigger picture of long-term loyalty, asking how likely a customer is to recommend your company to their friends or family.
- First Call Resolution (FCR): A crucial KPI that tracks the percentage of calls where the customer's problem is solved on the very first try, with no need for a follow-up.
High FCR rates are a massive win, signaling both happy customers and a competent operation. When you get it right the first time, you show customers you respect their time, which builds incredible trust.
Pillar 2: Operational Efficiency
Next up is the pillar of Operational Efficiency. If customer experience is about the 'what' (the outcome), efficiency is about the 'how' (the process). These KPIs dig into how smoothly your internal engine is running. Are your agents being productive? Are your workflows making sense?
Operational efficiency isn't about rushing agents off the phone. It's about removing internal obstacles so they can deliver excellent service without wasted effort or time.
Metrics that define this pillar are vital for managing your resources and keeping costs in check. For example, in the United Arab Emirates (UAE), call centers are heavily focused on First Call Resolution (FCR), Average Handle Time (AHT), and Customer Satisfaction (CSAT). The regional benchmark for FCR often sits above 70%, but hitting that is tough when agents don’t have the right tools. In fact, analysis shows that around 60% of FCR failures stem from a lack of data or resources. The most successful UAE companies are tackling this head-on by empowering agents with better training and tech, like skill-based routing. You can dive deeper into how regional strategies are influencing performance by reading the full research on call center statistics on LiveAgent.com.
Other critical efficiency KPIs include:
- Average Handle Time (AHT): The average time an agent spends on a single interaction, from the moment it starts until all the after-call work is done.
- Agent Utilization: The percentage of an agent's paid time that is spent actively handling customer interactions and related tasks.
- Call Abandonment Rate: The percentage of callers who give up and hang up before ever reaching an agent.
By keeping a close eye on these numbers, you can spot bottlenecks, fine-tune your workflows, and make sure your team is working smart, not just hard.
Pillar 3: Business Impact
The final pillar, Business Impact, is where everything comes together. It connects your call center’s day-to-day activities directly to the company's bottom line. These KPIs translate your operational performance into dollars and cents, proving the value your center brings to the entire organization.
This is where you answer the big questions, like, "How is our service actually affecting revenue?" and "What's the ROI on our contact center?"
Key business-focused KPIs are:
- Cost Per Contact: A fundamental measure of financial efficiency, calculated by dividing the total operational cost of the call center by the number of contacts handled.
- Customer Retention Rate: The percentage of customers who stick with your company over time—a number that is heavily influenced by the quality of service they receive.
- Sales Conversion Rate: For teams with a sales function, this measures the percentage of calls that lead to a closed deal.
By integrating these three pillars—Customer Experience, Operational Efficiency, and Business Impact—you create a truly balanced scorecard. This holistic view gives you the power to make sharp, strategic decisions that fuel success across the board.
Customer Experience KPIs That Build Loyalty
Excellent customer service doesn't just happen by chance—it's the result of carefully measuring what matters. While operational metrics are great for keeping costs in check, customer experience KPIs are what truly build loyalty and fuel long-term growth. These are the numbers that tell you how a customer feels after an interaction, moving past simple efficiency to capture genuine satisfaction.
By zeroing in on these specific kpis for call centers, you can turn a decent service interaction into a powerful engine for brand advocacy. It all comes down to making sure every customer walks away feeling heard, valued, and happy with the outcome.

This means we need to take a closer look at the metrics that count from the customer's point of view.
First Call Resolution (FCR)
Think about the last time you had to call a support line. You explain your whole situation, only to be told you need to call someone else or wait for a callback. It's incredibly frustrating. First Call Resolution (FCR) is the metric designed to stop that from happening.
FCR simply measures the percentage of customer issues that get completely solved on the very first contact. No transfers, no callbacks, no follow-ups. Done. This single KPI is a fantastic indicator of both your agents' skills and the efficiency of your internal processes. A high FCR tells you your team has the knowledge, the tools, and the authority to solve problems right then and there.
FCR isn't just about being fast; it's about being effective. When you fix an issue on the first try, you send a clear message to the customer: we respect your time and we know what we're doing.
Improving your FCR isn't about pushing agents to rush through calls. It takes a more strategic approach:
- Empower Your Agents: Give your team the authority to make decisions and handle a wider range of issues without needing a manager's approval.
- Invest in Training: Equip agents with deep product knowledge and sharp problem-solving skills so they’re ready for whatever comes their way.
- Build an Accessible Knowledge Base: Make sure agents can instantly find answers in an up-to-date, easy-to-search resource.
When your FCR rate goes up, you'll almost always see a direct jump in customer satisfaction and a drop in operational costs, since you're handling fewer repeat calls.
Customer Satisfaction (CSAT)
While FCR tells you if you solved the problem, Customer Satisfaction (CSAT) tells you how the customer felt about the whole experience. This KPI gives you instant, on-the-spot feedback. You measure it by asking a simple question right after an interaction, like, "How satisfied were you with your recent support experience?"
Customers typically respond on a 1-5 scale, from "Very Unsatisfied" to "Very Satisfied." The score is then calculated as the percentage of customers who gave a positive rating (usually a 4 or 5).
Think of CSAT as your real-time pulse check on service quality. Consistently low scores tied to a specific agent might signal a need for more coaching, while consistently high scores help you identify your star performers. Getting this right is crucial—a reported 66% of companies view customer satisfaction as the single most important metric for customer experience.
To make sure your CSAT data is reliable, follow these best practices:
- Time it Right: Send the survey the moment the interaction ends, while the experience is still fresh.
- Keep it Simple: A single, direct question is often more effective than a long, drawn-out survey.
- Ask for "Why": Always include an optional open-ended question like, "Could you tell us why you gave that score?" This is where you'll find priceless, actionable feedback.
Net Promoter Score (NPS)
If CSAT is a snapshot of a single moment, Net Promoter Score (NPS) is the wide-angle, panoramic photo of a customer's loyalty to your brand. It’s not about one call; it’s about their overall feeling and long-term sentiment.
NPS all comes down to one powerful question: "On a scale of 0-10, how likely are you to recommend our company to a friend or colleague?"
Based on how they answer, customers fall into one of three groups:
- Promoters (9-10): These are your champions. They’re loyal, enthusiastic fans who will actively tell others about you.
- Passives (7-8): They're satisfied, but not wowed. They're happy enough for now but could easily be tempted by a competitor.
- Detractors (0-6): These are unhappy customers who might not only leave but also share their negative experiences with others.
You calculate your NPS by subtracting the percentage of Detractors from the percentage of Promoters. The final score gives you a clear, high-level view of your brand’s health and is a strong predictor of future growth. A high NPS shows that your service isn't just solving problems—it's creating genuine fans.
For a deeper dive into other valuable metrics, our guide on essential contact centre KPIs offers more insights.
Operational Efficiency Metrics That Reduce Costs
While an outstanding customer experience builds loyalty, operational efficiency is what keeps your call center sustainable. Think of these kpis for call centers as the metrics for your engine room. They give you a real-time look at the mechanics of your operation, ensuring your team is productive, your processes are lean, and you're making the most of your resources.
An efficient operation isn't about rushing agents or cutting corners; it's about removing friction. By tracking these key performance indicators, you can pinpoint bottlenecks and streamline workflows. This translates directly into significant cost savings without ever compromising on the quality of service.
Decoding Average Handle Time
One of the most-watched operational KPIs has always been Average Handle Time (AHT). It’s a simple but powerful metric that measures the average length of a customer interaction, from the moment an agent answers until all the post-call work is done. It’s a holistic view that includes talk time, hold time, and that crucial wrap-up period.
But here’s the thing: the goal isn’t just to crush AHT down to its lowest possible number. A suspiciously low AHT is often a red flag, suggesting that agents are rushing through calls, providing half-baked answers, and inadvertently creating more repeat calls—which drives costs right back up. AHT is a balancing act between speed and thoroughness.
A healthy Average Handle Time reflects an agent who is both efficient and effective, resolving issues completely without wasting valuable time.
For instance, an AHT that is consistently high could signal deeper issues you need to address, such as:
- Agents not having the product or systems training they need.
- A clunky or hard-to-navigate knowledge base slowing them down.
- Overly complicated after-call work processes that need to be simplified.
By digging into your AHT data, you can uncover clear opportunities for coaching and process improvements that make your entire team more effective.
Tackling the Call Abandonment Rate
Next up is the Call Abandonment Rate, another critical efficiency metric. This one is straightforward: it measures the percentage of callers who hang up before ever speaking to a person. A high abandonment rate is a major warning sign. It screams customer frustration and points directly to potentially lost business.
In most industries, an abandonment rate below 5% is considered healthy. If you’re seeing numbers higher than that, it’s time to investigate. Callers might be waiting too long, getting lost in a confusing Interactive Voice Response (IVR) system, or just giving up out of sheer frustration.
To get this number down, look at the root causes. Is your IVR menu a labyrinth? Are your staffing levels mismatched with your peak call times? A great tool to combat this is offering a callback option. It gives customers a sense of control and dramatically reduces the number of people stewing in the queue.
Optimizing Agent Utilization and Occupancy
Finally, let’s talk about Agent Utilization and Agent Occupancy. They sound similar, but they measure two very different—and equally important—aspects of productivity.
- Agent Utilization is the percentage of an agent's paid time spent on call-related activities, which includes waiting for calls to come in. It tells you how much of their shift is actually dedicated to their core job.
- Agent Occupancy, on the other hand, measures the percentage of time an agent is actively busy on calls and with after-call work, but it excludes their idle or available time.
Here’s an easy way to think about it: Utilization tells you how much of an agent’s shift is available for work, while Occupancy tells you how busy they were during that available time.
Pushing for 100% occupancy might look good on a spreadsheet, but it’s a direct path to agent burnout. A healthy, sustainable occupancy rate is typically between 80-85%. This gives agents just enough breathing room between calls to stay fresh, focused, and ready for the next customer. That balance is crucial for keeping both productivity and morale high.
Effective quality assurance in call centers is directly tied to these efficiency metrics. When agents have the right tools and processes, their handle times improve and abandonment rates drop. For a deeper dive into the world of quality assurance KPI metrics, there are some excellent resources available that can help you connect service standards with operational effectiveness.
By keeping a close eye on these operational KPIs, you can build a highly efficient, cost-effective call center that still delivers the kind of service that keeps customers coming back.
The table below provides a quick-reference guide to the formulas and benchmarks for these key metrics.
Key Operational KPIs Formulas and Benchmarks
| KPI | Formula | Industry Benchmark |
|---|---|---|
| Average Handle Time (AHT) | (Total Talk Time + Total Hold Time + Total Wrap-Up Time) / Total Number of Calls | Varies by industry, but typically 6 minutes |
| Call Abandonment Rate | (Number of Abandoned Calls / Total Number of Incoming Calls) x 100 | Less than 5% |
| Agent Occupancy Rate | (Total Handle Time / (Total Handle Time + Total Available Time)) x 100 | 80-85% |
Tracking these numbers gives you the data you need to make smart, targeted improvements that strengthen your entire operation.
How KPIs Connect to Business Growth and Revenue
Your call center isn't just a place for answering questions; it's a powerful engine for growing your business and bringing in revenue. The key performance indicators you track every day are more than just operational stats—they are direct links to the company's bottom line. Understanding this connection is the key to proving your team's value to senior leadership.
When you can talk about your department's performance in the language of business—costs, revenue, and retention—the conversation shifts from day-to-day tactics to strategic impact. This section closes that gap, showing you exactly how specific kpis for call centers reflect financial health and drive sustainable growth.

Driving Financial Efficiency with Cost Per Contact
One of the clearest lines you can draw from operations to finance is through Cost Per Contact. This KPI is simple: it’s the total cost of running your call center divided by the total number of customer interactions. The result is a hard number that tells you exactly how much each customer conversation costs the business.
A high Cost Per Contact can be a red flag, pointing to issues with staffing levels, inefficient processes, or outdated technology. By focusing on improving operational metrics like Average Handle Time or First Call Resolution, you'll naturally bring this cost down. Walking into a leadership meeting with a plan to reduce Cost Per Contact by 10% is a powerful way to show you’re managing the budget effectively and contributing directly to profitability.
Linking Service Quality to Customer Retention
Great service isn't just a "nice to have." It’s a core driver of customer loyalty and, by extension, your long-term revenue. The Customer Retention Rate measures the percentage of customers who stick with you over time, and this KPI is deeply influenced by the quality of support they get from your team.
Every positive interaction in your call center is a deposit into the bank of customer loyalty. A high retention rate is the interest you earn on that investment, proving that exceptional service is a profit center, not a cost center.
Think about it: we all know it costs far more to attract a new customer than it does to keep an existing one. When your team resolves issues efficiently and leaves customers feeling good about the interaction, they are actively protecting a vital stream of revenue. A rising Customer Retention Rate is tangible proof that your call center’s efforts are strengthening the company's financial foundation.
You can learn more about how to set up the right performance metrics by checking out our comprehensive guide on choosing the best kpi for a call center at https://cloud-call-center.ae/2025/05/25/kpi-for-call-center/.
Turning Agent Performance into Tangible Revenue
For call centers that handle sales, the connection to revenue is even more direct. The Sales Conversion Rate is a critical KPI that tracks the percentage of customer interactions that actually result in a sale. This metric turns an agent's performance from something subjective into a clear dollar figure.
Boosting this rate isn't magic; it comes down to a smart blend of skills and strategy:
- Targeted Coaching: Working with agents on their persuasive communication skills and deepening their product knowledge.
- Effective Scripting: Giving them clear, compelling talking points that resonate with customer needs.
- Lead Quality: Making sure that the calls coming in are properly qualified and sent to the right agent.
By tracking and improving the Sales Conversion Rate, you can draw a straight line from agent training initiatives to increased company revenue. It gives you the hard data to prove that investing in your team's skills delivers a measurable—and impressive—return. This is how you show your department is not just a support function, but a vital part of the company's success.
Frequently Asked Questions About Call Center KPIs
When you start digging into KPIs for call centers, a lot of practical questions naturally come up. As managers and team leaders get serious about tracking performance, I’ve found the same few queries pop up time and time again. Let’s cut through the noise and get you some clear, straightforward answers.
Getting everyone on the same page about what you’re measuring—and why it matters—is the first step toward making real improvements.
Which Single KPI Is the Most Important?
I get this question all the time, and the honest answer is: there isn't one. The "most important" KPI depends entirely on what your business is trying to achieve right now. A one-size-fits-all approach just doesn't work here; your metrics have to mirror your goals.
For instance, if your main focus is building unshakable customer loyalty, then First Call Resolution (FCR) is probably your star player. It's a direct measure of how well you solve problems on the first try, and nothing builds customer trust faster than that.
But what if the pressure is on to cut costs? In that case, Cost Per Contact suddenly becomes the metric you can't take your eyes off. The best strategies I’ve seen use a balanced scorecard, pulling in KPIs that cover customer experience, operational efficiency, and overall business impact to get the full story.
The most important KPI is the one that best reflects progress toward your most critical business objective. Pick a primary KPI, but always back it up with a balanced set of secondary metrics.
How Often Should We Review Our KPIs?
There’s no single rule for how often you should check your KPIs. The right cadence depends on the metric itself. Some need a constant, real-time eye on them, while others only reveal their true meaning when you look at them over a longer stretch.
- Daily (or even hourly): This is for your operational metrics, like Average Handle Time and Call Abandonment Rate. Managers need this data to make quick, in-the-moment decisions about staffing or routing.
- Weekly or Monthly: This frequency is perfect for customer-focused KPIs like CSAT and FCR. It’s often enough to spot trends without getting distracted by small, daily blips.
- Quarterly: High-level, strategic KPIs like Customer Retention Rate fit perfectly into quarterly business reviews. This is where you connect contact center performance to the company's bigger picture.
What Is the Difference Between a Metric and a KPI?
This is a common point of confusion, but the distinction is actually pretty simple and incredibly useful. Think of it like this: a metric measures something, but a KPI measures something that is critical to a key business goal.
"Total calls handled" is a metric. It's just a number, a piece of data that tells you how busy your agents were. On the other hand, "First Call Resolution rate" is a KPI because it's directly linked to strategic goals like boosting customer satisfaction and running a more efficient operation.
In short, all KPIs are metrics, but only the most essential, goal-oriented metrics earn the title of KPI.
Ready to transform your customer engagement with a powerful, integrated contact center solution? Cloud Move offers customizable cloud, on-premise, and hybrid systems that unify all your communication channels. Get your free demo and expert consultation today.