

The Anatomy of Effective Call Center Reporting Dashboards
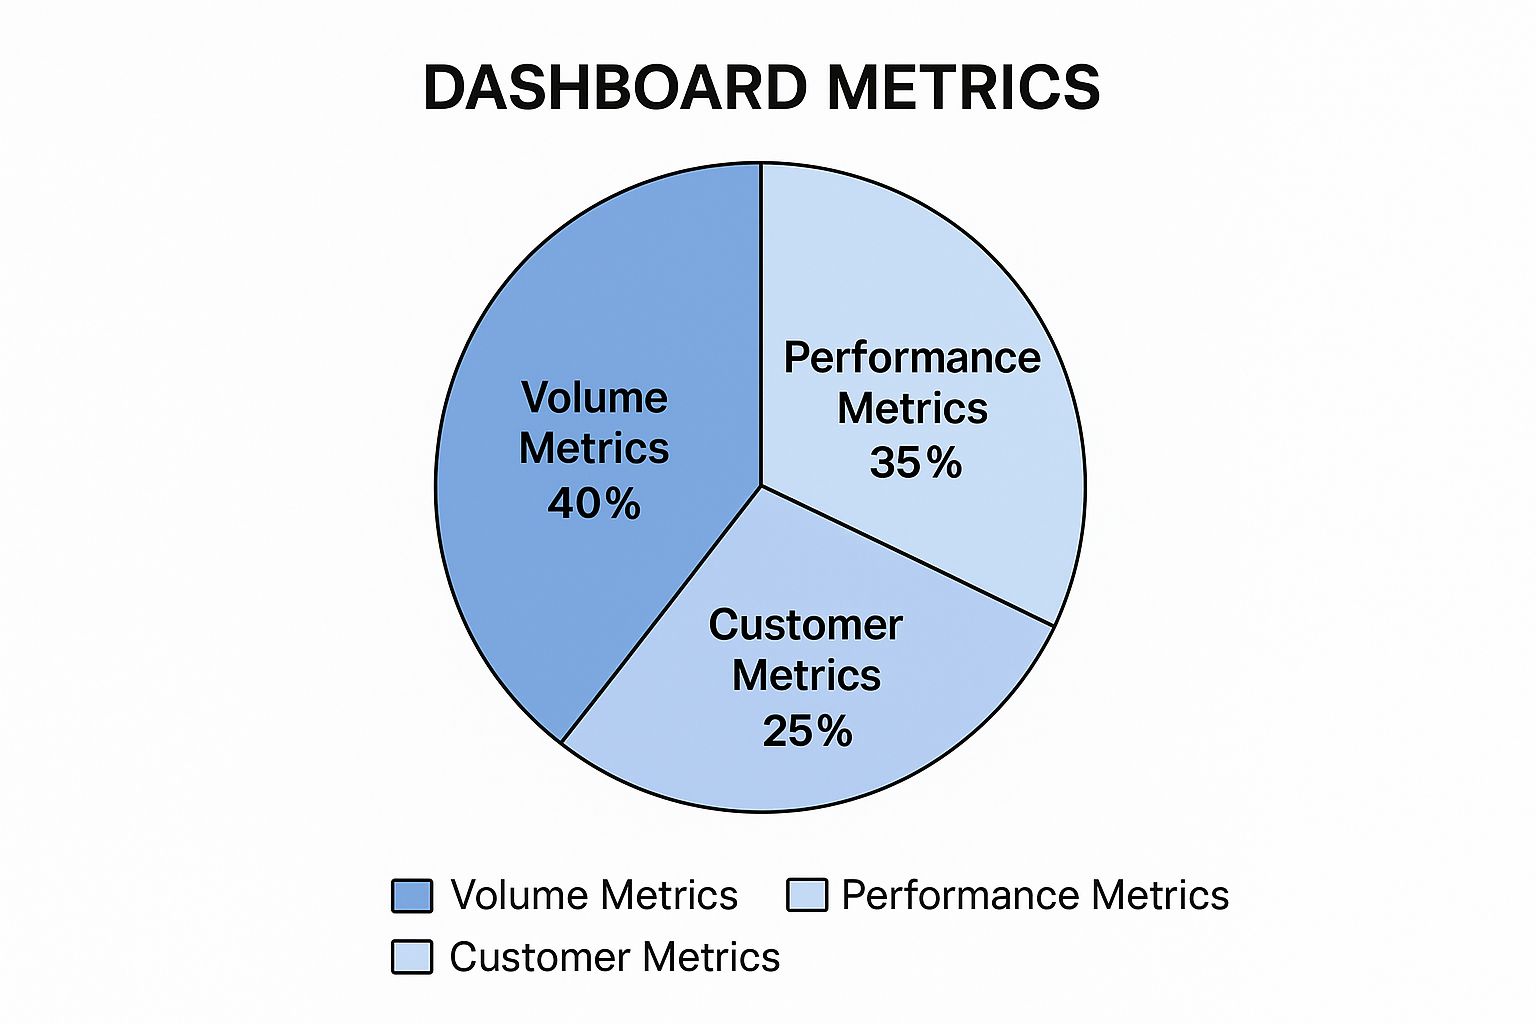
The infographic above highlights the core components of a comprehensive call center reporting dashboard. These components are categorized into Volume Metrics (40%), Performance Metrics (35%), and Customer Metrics (25%). This distribution underscores the need for balance between operational efficiency and customer experience.
While performance and volume metrics are critical for internal operations, they shouldn't overshadow customer-centric data. This balance is the key to informed decision-making that benefits both the business and its customers.
What makes a call center reporting dashboard truly valuable? It's the ability to provide actionable insights, not just raw data. Effective dashboards transform complex information into easily digestible visuals. This empowers stakeholders to quickly understand key trends and performance indicators.
For example, instead of simply presenting average handle time, a well-designed dashboard might visualize this metric alongside customer satisfaction scores. This approach can reveal important correlations and drive improvements.
Essential Components of a Call Center Reporting Dashboard
A robust call center reporting dashboard goes beyond basic metrics. It incorporates real-time data, historical trends, and customized views for various stakeholders. This empowers everyone within the organization to make data-driven decisions.
To illustrate the differences between basic and advanced dashboard implementations, let's examine the following table:
Essential Call Center Dashboard Components
This table outlines the critical elements that should be included in any effective call center reporting dashboard, comparing basic and advanced implementations.
| Dashboard Component | Basic Implementation | Advanced Implementation | Business Impact |
|---|---|---|---|
| Real-Time Monitoring | Displays current call volume and wait times | Integrates with workforce management tools for immediate staffing adjustments | Improved response times and reduced customer wait times |
| Historical Trend Analysis | Shows basic trends over a set period | Offers predictive analytics based on historical data | Proactive resource allocation and improved forecasting accuracy |
| Customizable Views | Limited filtering options | Personalized dashboards for different roles and departments | Enhanced decision-making at all levels of the organization |
This comparison reveals how advanced implementations of dashboard components significantly improve operational efficiency and strategic planning.
Key Metrics for Middle Eastern Call Centers
The Middle East call center market is experiencing significant growth. It reached $6,309.68 million in sales revenue in 2024 and is projected to grow at a CAGR of 12.2% from 2025 to 2033. This growth is driven by innovation and strategic partnerships across the region. Find more detailed statistics here.
This market expansion underscores the increasing importance of effective call center reporting in the region. Contact centers must adapt their dashboards to reflect regional nuances.
Additionally, call center reporting dashboards in the Middle East must consider unique regional factors. These include multilingual support and cultural communication preferences. Metrics like customer satisfaction should be analyzed within the context of these cultural differences.
Beyond Vanity Metrics
Effective call center reporting dashboards go beyond surface-level “vanity metrics” like call volume. They dive deeper into performance drivers. Analyzing metrics like first call resolution (FCR), customer effort score (CES), and agent satisfaction provides a more holistic view of call center performance.
These metrics offer valuable insights into areas for improvement. They enable data-driven decision-making. By focusing on these key metrics, Middle Eastern call centers can optimize their operations and deliver exceptional customer service in this dynamic market.
Selecting KPIs That Actually Drive Performance

Choosing the right Key Performance Indicators (KPIs) for your call center reporting dashboard is critical for driving meaningful improvements. Simply gathering data isn't enough. You need to focus on the metrics that directly influence your business objectives. This means looking beyond readily available data and concentrating on what truly affects your bottom line and customer experience. For a deeper dive into building an effective dashboard, check out this resource: Call Center Metrics Dashboard.
Categorizing KPIs by Business Impact
High-performing contact centers in the Middle East categorize their KPIs based on their impact on the business, not just on the ease of collection. This strategic approach ensures that resources and efforts are concentrated on the most impactful areas.
For example, while tracking call volume is simple, it doesn't provide insights into the effectiveness of your agents in resolving customer issues. That’s why focusing on categories is essential.
Grouping KPIs by business objectives, such as customer satisfaction, operational efficiency, or revenue generation, allows for a more focused and actionable dashboard. This also simplifies reporting and facilitates better communication of results across the organization.
Furthermore, categorizing KPIs helps pinpoint areas for improvement within specific business functions. This targeted approach allows for the development of more effective performance optimization strategies.
To illustrate this further, let's look at a practical example. The table below outlines several key call center KPIs categorized by their associated business objective:
The following table provides a comprehensive breakdown of essential call center metrics, organized by their primary business purpose and impact.
| Business Objective | Primary KPIs | Secondary KPIs | Measurement Frequency | Target Ranges |
|---|---|---|---|---|
| Customer Satisfaction | Customer Satisfaction Score (CSAT), Net Promoter Score (NPS) | First Call Resolution (FCR), Average Handle Time (AHT) | Monthly/Quarterly | CSAT: 90%+, NPS: 70%+ |
| Operational Efficiency | Occupancy Rate, Agent Utilization | Average Speed of Answer (ASA), Cost Per Call | Daily/Weekly | Occupancy: 70-80%, Utilization: 85%+ |
| Revenue Generation | Conversion Rate, Average Revenue Per Call | Lead Generation Rate, Customer Lifetime Value | Monthly/Quarterly | Varies by business |
This table demonstrates how focusing on specific business objectives can help select the most relevant KPIs. By tracking these metrics and aiming for the target ranges, call centers can significantly improve their overall performance.
Contextual Benchmarking vs. Industry Averages
While industry average benchmarks can offer a general overview, contextual benchmarking offers a more relevant comparison. Contextual benchmarking factors in specifics like your industry, customer base, and regional market. Instead of comparing your performance to a generic average, you're comparing it to similar organizations operating within the same context, such as within the UAE or Saudi Arabia.
This localized approach allows for a more accurate performance assessment and identifies areas ripe for improvement. It considers the unique challenges and opportunities within the AE region. For further insights into mastering KPIs, consider this article: How to master contact center KPIs.
Setting Meaningful Targets
Establishing meaningful targets for your KPIs is vital for motivating your team and driving continuous improvement. These targets should be ambitious yet attainable, reflecting your operational context. For instance, unrealistic First Call Resolution (FCR) targets can demotivate agents and hinder performance.
However, appropriately challenging targets, based on contextual benchmarking and historical data, can inspire agents to excel. This fosters a culture of continuous improvement within the contact center.
Predictive Indicators for Strategic Planning
Leading call centers in the AE region are utilizing predictive indicators to shift from reactive management to proactive strategic planning. This approach uses historical data and advanced analytics to anticipate future trends and optimize resource allocation. Instead of simply reacting to problems, you can anticipate and prevent them.
This forward-thinking approach leads to more efficient resource allocation and an improved customer experience. By anticipating future needs, contact centers can ensure adequate staffing and preparedness for fluctuating call volumes or emerging customer issues.
Analyzing historical call volume data and correlating it with marketing campaigns, for example, allows contact centers to predict call volume spikes and adjust staffing levels accordingly. This proactive approach minimizes customer wait times and maximizes agent productivity.
Cloud-Based Dashboards: Beyond The Implementation Hype

The appeal of cloud-based call center reporting dashboards is clear. These systems offer attractive benefits, including scalability, flexibility, and cost-effectiveness. However, contact centers in the Africa and the Middle East (AE) region must carefully consider regional factors when transitioning to the cloud. This includes addressing specific regulatory compliance requirements, data sovereignty concerns, and the unique infrastructural landscape of the region.
For instance, data sovereignty regulations in countries like the UAE and Saudi Arabia require careful selection of cloud providers that comply with local laws. Integrating cloud dashboards with existing legacy systems can also present a technical challenge, often necessitating a phased approach to migration. This means balancing the need for rapid deployment with maintaining operational continuity during the transition. Careful planning and choosing the right technology partners are essential for success.
Regional Challenges And Opportunities
Migrating to cloud-based call center reporting dashboards offers both opportunities and challenges specific to the Middle East. Security is paramount, and organizations must ensure their data is protected according to both international best practices and local regulations. The growth of cloud services in the region has led to an increased availability of providers adhering to these stringent requirements.
The rise of distributed teams, especially following recent global events, further fuels the need for flexible access to reporting data. Cloud-based dashboards inherently support this trend, offering real-time insights to team members regardless of location. However, reliable internet access remains a concern in some areas, demanding robust connectivity solutions for consistent dashboard performance. Selecting the right Key Performance Indicators (KPIs) is crucial for a call center reporting dashboard. Learn more about choosing effective customer service performance indicators.
Integrating With Legacy Systems
Integrating with legacy systems is a significant implementation hurdle for cloud-based dashboards. Many Middle Eastern contact centers rely on older, on-premise infrastructure. Connecting these systems to a cloud-based dashboard demands careful planning and execution, often involving APIs or middleware to bridge the gap between different technologies.
Realistic migration timelines are also essential. A phased approach, beginning with non-critical systems and gradually migrating core functions, minimizes disruption and allows for thorough testing at each stage. This safeguards operational continuity and allows teams to adapt to the new system incrementally. A successful transition also requires a commitment to ongoing training and support for staff.
Leveraging Cloud Flexibility
Forward-thinking organizations in the UAE and Saudi Arabia are utilizing the flexibility of cloud-based dashboards to address regional infrastructure challenges. For example, they use cloud scalability to manage peak call volumes during Ramadan and other major events. The Middle East and Africa contact center as a service (CCaaS) market generated USD 487.9 million in 2024 and is projected to grow at a CAGR of 22.2% from 2025 to 2030, driven by the adoption of cloud-based solutions. Learn more about CCaaS market growth.
This rapid growth highlights the shift towards cloud-based solutions in the region. By embracing cloud technology, contact centers can better support distributed teams, adapt to fluctuating demand, and access advanced analytics to improve decision-making and drive business performance. This includes features like omnichannel support and real-time analytics, catering to the evolving demands of the Middle Eastern market. Cloud-based solutions also enable contact centers to scale quickly and accommodate call volume fluctuations, a critical factor in a region with dynamic market conditions.
Real-Time Analytics: From Data Overload to Actionable Insights
Real-time dashboards offer incredible potential for contact centers, but they can also become just another source of overwhelming data. This section explores how leading Middle Eastern contact centers are successfully transforming streaming data into immediate, impactful actions. We'll examine practical examples and delve into the psychology of effective alert design, striking a balance between urgency and avoiding the dreaded alarm fatigue. We’ll also discuss how successful operations develop escalation protocols that seamlessly integrate with their organizational structure.
Turning Real-Time Data into Action
Imagine a contact center in Dubai during the bustling Gitex Technology Week. Call volume surges unexpectedly. With a real-time call center reporting dashboard, managers instantly see the spike and can quickly adjust staffing levels. This might involve pulling agents from less busy queues or initiating on-call procedures. This rapid response minimizes wait times, maintains service levels, and prevents customer frustration.
This responsiveness is just one example of how real-time analytics empowers action. These dashboards are not simply monitoring tools; they are tools for dynamic management.
The Psychology of Alerts: Avoiding Alarm Fatigue
A constant stream of alerts can lead to alarm fatigue. If every minor fluctuation triggers a notification, agents and supervisors begin to ignore them, rendering real-time monitoring ineffective. Effective dashboards in the Arab Emirates region address this by employing intelligent alert systems that prioritize critical issues.
For example, instead of an alert for every abandoned call, the system might only trigger a notification if the abandonment rate exceeds a predefined threshold within a specific timeframe. This targeted approach ensures alerts remain meaningful and actionable.
Escalation Protocols: Matching Organizational Structure
Real-time insights are most valuable when combined with clearly defined escalation protocols. These protocols must be aligned with the specific hierarchies and communication channels within each organization. A streamlined process ensures that critical issues reach the appropriate personnel promptly, facilitating swift resolution and preventing minor issues from escalating into major incidents.
Think of a well-oiled machine: each component understanding its role and interacting smoothly with the others. This is particularly important in multilingual and multicultural environments like the UAE and Saudi Arabia, where clear communication and defined roles are essential for operational efficiency.
Real-Time Coaching: Transforming Interactions
Beyond immediate responses to operational metrics, real-time dashboards enable in-the-moment coaching. Supervisors can observe agent performance live, identify areas for improvement, and provide immediate feedback. This focused coaching elevates average customer interactions into exceptional experiences, reinforcing positive behaviors and addressing performance gaps in real time. This proactive approach ultimately boosts customer satisfaction and loyalty.
Technical Infrastructure for Real-Time Reporting
The benefits of real-time analytics are clear, but implementation requires a robust technical infrastructure. This includes reliable, high-speed internet connectivity, a critical factor in diverse regional environments. Integration with existing CRM and telephony systems is also crucial for a unified view of customer interactions. This seamless integration allows agents to access complete customer profiles, enhancing personalization and promoting first-call resolution.
Choosing the right platform is paramount. Cloud Move specializes in deploying customized cloud contact center solutions, leveraging platforms like Xcally, Microsoft Teams Voice Direct Routing, and Zoom Phone BYOC. This expertise ensures reliable real-time reporting, even within the unique technical landscape of the Arab Emirates region.
Furthermore, real-time reporting demands a commitment to data security and compliance with local regulations. Cloud Move's adherence to these requirements ensures sensitive customer data remains protected, while providing the flexibility and scalability necessary to meet the evolving needs of modern contact centers. With the rapid growth of the CCaaS (Contact Center as a Service) market in the region, selecting a partner with a deep understanding of regional regulations is crucial for sustained success.
Tailoring Dashboard Views For Every Stakeholder
Generic call center reporting dashboards often fail to meet the specific needs of diverse users. Just as different professionals require specialized tools, different roles within a call center need access to different information. This section explores creating tailored reporting experiences that empower every role within a Middle Eastern contact center.
Understanding Stakeholder Needs
Effective dashboard design starts with understanding each stakeholder's informational needs. For example, agents benefit from real-time feedback on individual performance metrics like call resolution times and customer satisfaction scores. This allows for immediate adjustments and encourages continuous improvement.
Team leaders, however, require a broader perspective. They focus on team performance trends and identify areas for coaching and development. You might be interested in: How to master call center quality monitoring.
Finally, executives need high-level summaries of overall contact center performance, focusing on key business indicators like customer churn rate and revenue generation.
This targeted approach ensures each dashboard provides the most relevant information, delivering actionable insights rather than overwhelming users with data.
Balancing Standardization And Personalization
While personalized dashboards are essential, maintaining standardization is crucial for data consistency and reporting efficiency. Like a restaurant menu offering variety within a structured framework, call center dashboards can offer customized views while maintaining standardized underlying metrics and reporting structures.
This balance is achieved through role-based access controls, defining specific data sets and visualization options available to different user roles. This ensures data relevance while preserving overall consistency.
Regional Considerations: Organizational Hierarchies And Cultural Preferences
In the Middle East, organizational hierarchies and cultural preferences significantly influence dashboard design. Dashboards should respect these structures, providing appropriate access and information flow based on seniority and responsibility.
Interface design should also consider cultural nuances, such as language preferences and reading patterns. For instance, right-to-left language support for Arabic-speaking users enhances usability and encourages adoption. This localized approach respects cultural values and contributes to a more positive user experience.
Visual Hierarchies: Guiding Attention To Key Metrics
A cluttered dashboard is ineffective. Creating clear visual hierarchies is vital for guiding users' attention to the most important metrics. This involves using visual cues like size, color, and placement to emphasize key data points and minimize distractions.
Just as a newspaper headline immediately draws attention to crucial information, a well-designed dashboard prioritizes key metrics, allowing users to quickly grasp overall performance and identify areas needing immediate attention.
Fostering Collaboration
Leading companies in the AE region use call center reporting dashboards to foster a collaborative problem-solving culture. By providing shared data access and encouraging open communication around performance trends, these dashboards become tools for continuous improvement. This empowers teams to identify and address challenges collectively, fostering shared ownership and driving better outcomes. For example, a team leader can use the dashboard to highlight areas where agents are struggling and then collaborate with the team to develop solutions and improve performance.
Bridging the Gap: Integrating Outsourced Operations

Outsourcing parts of your call center operations can be a strategic move, potentially offering significant cost savings and access to specialized skill sets. However, integrating these external teams into your reporting structure can present unique challenges, potentially leading to data discrepancies and incomplete performance overviews. This is especially pertinent in the Middle East, a region with a high prevalence of outsourced call center partnerships. This section explores the hurdles and solutions associated with seamlessly incorporating outsourced operations into your reporting ecosystem.
Standardizing Metrics Across Teams
One of the primary challenges lies in ensuring consistent metrics across all teams. Effective management hinges on reliable measurement, and these measurements must be uniform for both in-house and outsourced teams. Comparing performance with disparate metrics is like comparing apples and oranges – it yields meaningless results. Therefore, establishing clear definitions and standardized data collection procedures for all Key Performance Indicators (KPIs) is essential, regardless of agent location.
For instance, if Average Handle Time (AHT) is a crucial metric, its calculation method must be identical for both internal and external teams. This ensures a level playing field for performance evaluations and comparisons. This standardization also fosters informed decision-making and promotes accountability across the entire operation.
Data Sharing Protocols and Security
Sharing data with external partners is crucial for insightful reporting, but it also necessitates careful consideration of security and confidentiality. Establishing robust data sharing protocols is paramount. These protocols should clearly define what data is shared, how it's transmitted, and who has access to it. This is particularly critical in the Middle East, given the region's specific data sovereignty regulations and security considerations.
Furthermore, contractual agreements should explicitly delineate responsibilities for data security and compliance. This ensures all parties understand their obligations, mitigating risk and fostering a secure data environment. These agreements should also address data breach procedures and liabilities for all stakeholders.
Accountability Across Organizational Boundaries
Successfully integrating outsourced operations requires clear accountability mechanisms that transcend organizational boundaries. Defining clear roles, responsibilities, and performance expectations for both internal and outsourced teams is critical for success. This clarity eliminates ambiguity and fosters a sense of ownership over results. Regular performance reviews, utilizing data from the integrated call center reporting dashboard, further reinforce accountability.
This shared accountability framework strengthens partnerships and promotes a collaborative environment. It encourages continuous improvement across all teams, driving better outcomes for the organization and enhancing the overall customer experience.
Case Studies from the UAE and Saudi Arabia
Leading companies in the UAE and Saudi Arabia are successfully integrating outsourced operations into their reporting dashboards. Their success stems from prioritizing clear communication, establishing comprehensive data sharing agreements, and implementing standardized metrics. These organizations recognize that cultural sensitivity and robust relationship management are vital for overcoming the inherent challenges of cross-organizational collaboration.
The increasing prevalence of outsourcing in the region further emphasizes the importance of these best practices. The Middle East and Africa call and contact center outsourcing market is projected to grow at a compound annual growth rate of 10.4% from 2025 to 2030. Learn more here. By studying these regional success stories, other organizations can adopt similar strategies to gain a unified and comprehensive view of call center performance, regardless of agent location. This holistic perspective empowers data-driven decision-making and ultimately leads to an improved customer experience.
The Next Evolution of Call Center Reporting Dashboards
The contact center landscape in the Middle East is changing. This fast-paced environment requires call center reporting dashboards that go beyond static data. These tools must deliver actionable insights and facilitate real-time decision-making. This shift is fueled by increasingly complex customer journeys and the growing use of digital channels across the region.
AI-Enhanced Analytics: Beyond Visualization
Leading contact centers in the UAE and Saudi Arabia are moving past basic data visualization. They are adopting AI-enhanced analytics that automatically surface key insights. This means dashboards are becoming less about manual interpretation and more about receiving proactive recommendations.
For instance, voice sentiment analysis can instantly detect customer frustration or satisfaction during calls. This provides immediate feedback to agents and supervisors. Similarly, predictive behavioral modeling can anticipate customer needs and offer proactive solutions, improving the customer experience. Learn more in our article about quality assurance in call centers.
Visualizing the Customer Journey
Understanding the customer journey is essential for optimizing contact center operations. Modern call center reporting dashboards now include customer journey visualization tools. These tools map every customer interaction, from initial contact to resolution.
This comprehensive overview allows for a detailed understanding of customer behavior. It highlights pain points and reveals opportunities to improve the customer experience. Visualizing customer drop-off points, for example, can pinpoint areas for improvement.
Preparing for the Omnichannel Future
Middle Eastern markets are experiencing unique digital adoption trends. Contact centers must adapt their reporting to support increasingly complex omnichannel customer journeys. This requires integrating data from multiple channels – voice, email, chat, and social media – into a single dashboard view.
This integrated approach provides a complete picture of customer interactions. It allows contact centers to offer a consistent experience across all channels. It also provides valuable insights into channel preferences and customer behavior. This data-driven approach helps optimize resources and strategies.
Separating Hype From Reality
While new technologies present compelling possibilities, it's important to distinguish between genuine value and hype. Not every emerging technology is ready for implementation. Successful contact centers carefully evaluate new solutions before adoption, focusing on practical benefits and demonstrable ROI. They also invest in training to equip their teams with the skills to use these tools effectively.
This prudent approach minimizes risk and ensures that technology investments deliver real business value. It allows organizations to effectively utilize innovation, driving better performance and enhancing the customer experience in the ever-changing Middle Eastern market.
Ready to transform your call center reporting with powerful cloud solutions? Explore how Cloud Move can empower your business with real-time insights and actionable analytics. Visit Cloud Move today for a free demo and personalized consultation.