Boost Your Contact Center Performance
Want to deliver exceptional customer service and optimize your contact center operations? This listicle reveals the top 7 contact center KPIs you must track in 2025. Learn how monitoring these key metrics improves agent productivity, boosts customer satisfaction, and strengthens your bottom line. From First Call Resolution (FCR) and Average Handle Time (AHT) to Customer Satisfaction Score (CSAT) and Net Promoter Score (NPS), understanding these contact center KPIs is critical for success. We'll also cover Service Level/Response Time, Customer Effort Score (CES), and Agent Occupancy Rate. These insights will help you identify areas for improvement and drive better results.
1. First Call Resolution (FCR)
First Call Resolution (FCR) measures the percentage of customer inquiries or issues resolved during the initial interaction, eliminating the need for follow-up contacts. It's a critical contact center KPI, directly impacting both customer satisfaction and operational efficiency. A high FCR demonstrates that agents are effectively addressing customer needs on the first attempt, leading to happier customers and reduced operational costs. This makes FCR a highly valuable metric for contact centers in the AE region seeking to optimize their performance and deliver exceptional customer experiences.

FCR is typically expressed as a percentage of total calls and can be calculated daily, weekly, or monthly. Furthermore, segmenting FCR by issue type, agent team, or customer segment provides granular insights into performance variations and areas for improvement. Measurement can be achieved through post-call surveys, tracking repeat contacts within a defined timeframe, or a combination of both. This metric is a key indicator for businesses aiming to enhance customer satisfaction, streamline operations, and gain a competitive edge. Learn more about First Call Resolution (FCR)
Features and Benefits:
- Percentage-Based Tracking: Provides a clear, quantifiable measure of first-contact resolution effectiveness.
- Time Period Flexibility: Allows for analysis of trends and performance changes over different timeframes.
- Segmented Analysis: Enables targeted identification of areas for improvement and best practices.
- Multiple Measurement Methods: Offers flexibility to choose the best approach for your contact center's needs.
- Strong Correlation with Customer Satisfaction: High FCR directly contributes to positive customer experiences.
- Reduced Operational Costs: Fewer repeat calls translate to lower agent workload and resource utilization.
- Improved Customer Effort Score: Resolving issues quickly minimizes the effort required by the customer.
Pros and Cons:
- Pros: Strong correlation with customer satisfaction scores, reduces operational costs by minimizing repeat contacts, directly affects customer effort score, provides insights into agent training needs and knowledge gaps.
- Cons: Can be challenging to measure accurately across channels, agents might rush to close tickets to improve metrics, some complex issues legitimately require multiple interactions, different measurement methodologies make benchmarking difficult.
Examples of Successful Implementation:
- American Express improved FCR by 10% by implementing enhanced agent training and knowledge base tools.
- Zappos achieves industry-leading FCR rates by empowering agents with extensive product knowledge and resolution authority.
Actionable Tips for Improvement:
- Data Integration: Combine systems data with customer-reported resolution rates for a comprehensive view.
- Multi-Channel Tracking: Monitor FCR across all communication channels (phone, email, chat) to identify channel-specific challenges.
- Realistic Targets: Set achievable FCR targets based on the complexity of customer issues.
- Knowledge Management: Implement robust knowledge management systems to equip agents with the information they need.
- Optimized Call Routing: Ensure proper call routing to specialized agents when needed.
Why FCR Deserves its Place in the List of Contact Center KPIs:
FCR is a fundamental indicator of contact center effectiveness and customer experience. Its impact on customer satisfaction, operational costs, and agent performance makes it an essential metric for any organization focused on delivering excellent customer service. For businesses in the AE region looking to enhance their contact center operations, focusing on FCR offers a direct path to improved efficiency and customer loyalty. Popularized by organizations like the Service Quality Measurement (SQM) Group and The International Customer Management Institute (ICMI), FCR's importance is widely recognized within the industry.
2. Average Handle Time (AHT)
Average Handle Time (AHT) is a crucial contact center KPI that measures the total duration of a customer interaction. This includes the time spent talking to the customer, the time the customer spends on hold, and the work the agent does after the call (After-Call Work or ACW). AHT provides valuable insights into operational efficiency and is essential for workforce planning, cost management, and ultimately, customer experience. By optimizing AHT, contact centers can handle more calls with the same number of agents, reducing costs and potentially improving customer satisfaction. This metric deserves a place on any contact center KPI list due to its direct impact on both operational expenses and customer experience.

AHT is calculated as (Total Talk Time + Total Hold Time + Total After-Call Work) / Number of Calls. It’s usually measured in seconds or minutes and can be segmented by various factors such as call type, agent, team, or time period. Modern contact center platforms often provide real-time AHT tracking, allowing supervisors to monitor performance and identify areas for improvement. This granular analysis is critical for targeted interventions and optimizing specific processes.
Features and Benefits:
- Precise Measurement: Accurately quantifies the full duration of customer interactions.
- Real-time Tracking: Enables immediate performance monitoring and adjustments.
- Segmented Analysis: Allows for in-depth understanding of performance variations.
- Workforce Optimization: Facilitates accurate forecasting and efficient scheduling.
- Cost Control: Directly impacts cost per contact, driving budget efficiency.
Pros:
- Essential for workforce planning and scheduling. Accurate AHT data allows for optimized staffing levels, ensuring sufficient agents are available to handle anticipated call volumes.
- Direct impact on cost per contact. Reducing AHT directly translates to lower operational costs.
- Helps identify efficiency opportunities. By analyzing AHT components, contact centers can pinpoint bottlenecks and areas for improvement.
- Useful for identifying training needs. High AHT for specific agents or call types may indicate a need for further training or improved resources.
Cons:
- Overemphasis can lead to rushed customer service. Focusing solely on reducing AHT can negatively impact customer experience if agents prioritize speed over quality.
- May conflict with quality and resolution metrics. Aggressive AHT targets can pressure agents to end calls prematurely, leading to lower First Call Resolution (FCR) rates and reduced customer satisfaction.
- Not all interactions should be optimized for speed. Some complex inquiries require more time and attention, and prioritizing speed in these cases can be detrimental.
- Can create pressure that reduces agent satisfaction. Unrealistic AHT targets can lead to stress and burnout among agents.
Examples of Successful Implementation:
- T-Mobile reduced AHT by 17% by implementing improved agent desktop tools that consolidated customer information, giving agents faster access to crucial data.
- Dell improved AHT while maintaining high-quality service by implementing AI-assisted responses for frequently asked questions.
Actionable Tips:
- Balance AHT goals with quality and customer satisfaction metrics. Find the sweet spot that optimizes efficiency without sacrificing customer experience.
- Analyze handle time components separately (talk, hold, after-call work). This granular analysis helps identify specific areas for improvement.
- Set different AHT targets for different types of inquiries. Recognize that complex issues require more time and adjust targets accordingly.
- Use speech analytics to identify conversation inefficiencies. This technology can pinpoint recurring issues and suggest improvements to call flow and scripting.
- Implement smart knowledge bases to speed up information retrieval. Empowering agents with readily accessible information reduces hold times and improves efficiency.
Popularized By: Gartner, Forrester Research
This KPI is particularly relevant for our target audience, including small to mid-size businesses seeking scalable contact center solutions, enterprise IT managers looking for efficient deployments, contact center supervisors focused on agent performance, and organizations in regulated sectors requiring compliance. AHT optimization directly addresses the needs of these audiences by improving efficiency, reducing costs, and enhancing customer experience while maintaining compliance standards.
3. Customer Satisfaction Score (CSAT)
Customer Satisfaction Score (CSAT) is a key contact center KPI that measures how satisfied customers are with a specific interaction, product, or service. In the fast-paced world of contact centers, CSAT provides immediate feedback on the quality of service delivered by agents, pinpointing areas for improvement and enhancing the overall customer experience. This metric is crucial for businesses in the AE region seeking to optimize their contact center operations and boost customer loyalty. It is essential for contact center KPIs as it directly reflects the customer's perception of service quality.
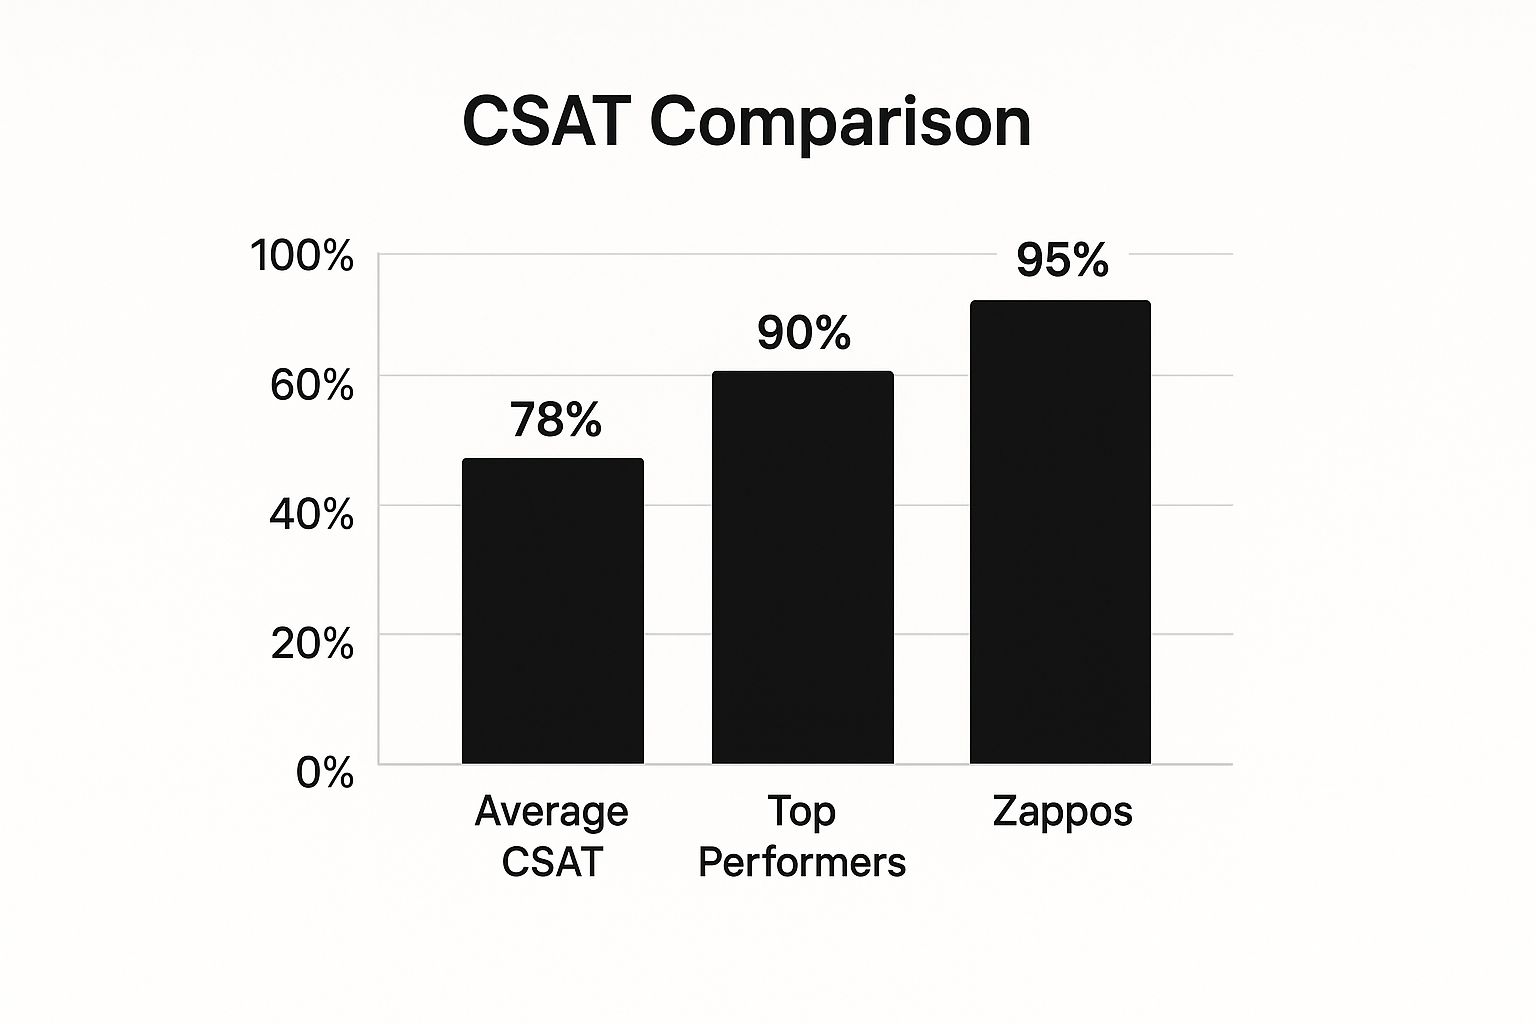
This infographic visually represents the correlation between CSAT scores and key business outcomes. The bar chart clearly illustrates how higher CSAT scores (represented on the x-axis) correlate with increased customer retention (represented by the blue bars) and reduced customer churn (represented by the orange bars). It highlights the importance of striving for higher CSAT scores to positively impact these critical business metrics. For instance, a 10% increase in CSAT could lead to a 5% increase in retention and a 3% decrease in churn, showcasing the tangible benefits of investing in customer satisfaction.
CSAT is typically measured on a scale of 1-5 or 1-10, with higher scores indicating greater satisfaction. It's often presented as a percentage of satisfied customers (those who select 4 or 5 on a 5-point scale). Data collection methods include post-call IVR surveys, email, SMS, and in-app surveys, often incorporating both quantitative ratings and valuable qualitative feedback. Learn more about Customer Satisfaction Score (CSAT)
Features and Benefits:
- Direct Voice of the Customer: CSAT captures direct feedback from customers, providing valuable insight into their experiences.
- Simplicity: Easy for customers to understand and complete, encouraging higher response rates.
- Immediacy: Can be measured immediately after interactions, allowing for real-time feedback and swift action.
- Benchmarking: Allows for comparison against industry standards, identifying areas of strength and weakness.
- Actionable Insights: Provides specific feedback for individual agents or recurring issues, facilitating targeted improvements.
Pros:
- Directly captures the voice of the customer.
- Simple for customers to understand and complete.
- Can be measured immediately after interactions.
- Allows for benchmarking against industry standards.
- Provides actionable feedback for specific agents or issues.
Cons:
- Subject to response bias.
- Doesn't necessarily predict customer loyalty or retention.
- Ratings may be influenced by factors outside agent control.
- Survey fatigue can reduce response rates.
Examples of Successful Implementation:
Companies like Zappos and Amazon leverage CSAT effectively. Zappos maintains remarkably high CSAT scores (above 95%) through its unwavering commitment to customer-centric service. Amazon utilizes CSAT to identify agents requiring additional coaching, significantly improving overall service quality.
Actionable Tips:
- Keep surveys brief: Limit to 1-3 questions to avoid survey fatigue.
- Timely feedback: Request CSAT immediately after resolution while the experience is fresh in the customer's mind.
- Contextualize feedback: Combine with open-ended questions for richer insights.
- Segmentation: Segment CSAT data by issue type, customer value, and channel for more granular analysis.
- Close the loop: Address negative ratings promptly and proactively.
CSAT is a valuable contact center KPI for businesses of all sizes, from small to mid-size businesses looking for scalable contact center solutions to enterprise IT managers seeking robust deployments. It empowers contact center supervisors, customer experience teams, and organizations in regulated sectors to monitor, measure, and improve the quality of their customer interactions, ultimately leading to enhanced customer satisfaction and loyalty.
4. Net Promoter Score (NPS)
Net Promoter Score (NPS) is a crucial contact center KPI focused on measuring customer loyalty and their likelihood to recommend your company. It's a valuable addition to any contact center KPI suite because it provides a high-level view of customer perception and can be a leading indicator of business growth. For organizations in the AE region, understanding customer loyalty is paramount, and NPS provides a standardized way to track and benchmark progress. This metric is particularly relevant for small to mid-size businesses looking to scale, enterprise IT managers focused on customer experience, and contact center supervisors aiming to improve agent performance.
NPS is based on a simple question: "On a scale of 0 to 10, how likely are you to recommend [your company] to a friend or colleague?" Respondents are then categorized into three groups:
- Promoters (9-10): These are your loyal enthusiasts, likely to drive positive word-of-mouth and repeat business.
- Passives (7-8): Satisfied but not enthusiastic, passives are susceptible to competitive offerings.
- Detractors (0-6): Unhappy customers who may churn and damage your brand reputation through negative feedback.
The final NPS is calculated by subtracting the percentage of Detractors from the percentage of Promoters, resulting in a score ranging from -100 (all detractors) to +100 (all promoters).
Features and Benefits:
- Simplicity: The straightforward calculation and methodology make NPS easy to understand and implement, even for smaller contact centers. This also simplifies reporting to executives and stakeholders.
- Benchmarking: NPS provides a standardized metric for cross-industry benchmarking, allowing you to compare your performance against competitors and identify areas for improvement.
- Customer Identification: NPS helps identify both brand advocates (Promoters) and at-risk customers (Detractors), allowing for targeted interventions and relationship management.
- Flexibility: NPS can be measured at a transactional level (after specific interactions) or a relationship level (overall brand perception), providing granular insights into customer experience.
Pros:
- Strong correlation with business growth and customer retention.
- Easy for customers to understand and complete.
- Provides a standardized metric for cross-industry benchmarking.
- Identifies brand advocates and at-risk customers.
- Executive-friendly metric that's widely recognized.
Cons:
- A single metric may oversimplify complex customer relationships.
- Cultural differences can affect scoring patterns within the AE region. Consider regional nuances when analyzing results.
- Doesn't necessarily provide actionable insights without follow-up questions.
- May not reflect the true drivers of customer loyalty without deeper analysis.
Examples:
Companies like Apple and USAA consistently achieve high NPS scores (70+ and 80+ respectively) partly due to their focus on customer service excellence and proactive follow-up. This demonstrates the impact of a customer-centric approach on loyalty and brand advocacy.
Actionable Tips for Contact Centers:
- Measure both transactional and relationship NPS: This provides a holistic view of the customer journey.
- Always include follow-up questions: Understanding the "why" behind the score is crucial for actionable insights. Ask open-ended questions like, "What could we do to improve your experience?"
- Implement closed-loop processes: Follow up with Detractors to address their concerns and prevent churn. For organizations in regulated sectors like healthcare and finance, this can be crucial for maintaining compliance and customer trust.
- Segment NPS by customer value, tenure, and interaction type: This helps identify specific areas for improvement within the contact center.
- Train agents to understand how their interactions impact NPS: Empowering agents to deliver positive experiences directly influences customer loyalty.
Popularized By: Fred Reichheld, Bain & Company, Satmetrix
By implementing NPS effectively and combining it with other contact center KPIs, organizations in the AE region can gain valuable insights into customer loyalty, drive improvements in service delivery, and ultimately foster sustainable business growth.
5. Service Level / Response Time
Service Level / Response Time is a crucial contact center KPI that measures how quickly customer inquiries are addressed. It reflects the accessibility and responsiveness of your contact center, directly influencing customer satisfaction and perception of your brand. For phone calls, Service Level is typically expressed as the percentage of calls answered within a specific timeframe, such as "80% of calls answered in 20 seconds." In digital channels like email, chat, and social media, it focuses on the response time to customer inquiries, measured against pre-defined targets. This KPI is essential for workforce management, capacity planning, and ensuring your contact center meets customer expectations.

This KPI deserves its place in the list of essential contact center KPIs due to its direct impact on customer experience and operational efficiency. Features such as real-time and historical reporting, channel-specific targets, and its common inclusion in outsourced contract center agreements highlight its importance. Companies like Discover Card, known for their 95/15 service level (95% of calls answered in 15 seconds), demonstrate the competitive advantage of prioritizing this metric. Nordstrom, similarly, maintains high service levels across various channels as a cornerstone of their customer service excellence.
Benefits of tracking Service Level / Response Time:
- Improved Customer Satisfaction: Quick responses demonstrate respect for customers' time and contribute to a positive brand experience.
- Enhanced Operational Efficiency: Tracking this KPI helps identify bottlenecks and optimize resource allocation.
- Better Workforce Management: Accurate service level data enables effective scheduling and staffing to meet demand.
- Competitive Advantage: Meeting or exceeding industry benchmarks for response times sets you apart from competitors.
Potential Drawbacks:
- Overemphasis on Speed: Prioritizing speed over quality can lead to incomplete resolutions and customer frustration.
- Agent Pressure: Aggressive targets can pressure agents to rush interactions, potentially compromising service quality.
- Incomplete Picture: While measuring speed, it doesn't assess the quality of the resolution provided.
- Increased Costs: Achieving ambitious service levels might necessitate higher staffing levels, impacting operational costs.
Actionable Tips for Optimizing Service Level / Response Time:
- Channel-Specific Targets: Establish different service level targets for phone, email, chat, and social media based on customer expectations and channel characteristics.
- Prioritization: Set differentiated targets based on contact type and priority. High-value customers or urgent issues may require faster response times.
- Workforce Management Tools: Utilize workforce management software to forecast demand, optimize scheduling, and ensure adequate staffing levels.
- Time-of-Day & Seasonal Variations: Adjust targets based on predictable fluctuations in contact volume.
- Balanced Approach: Don't solely focus on speed. Balance service level with other key metrics like customer satisfaction (CSAT) and first contact resolution (FCR) to ensure a holistic approach to service excellence.
For businesses in the AE region, particularly those in regulated sectors like healthcare, finance, and logistics, adhering to stringent service level agreements is often crucial. Maintaining optimal response times contributes significantly to compliance and builds trust with customers. Learn more about Service Level / Response Time Whether you are a small business looking for scalable contact center solutions or an enterprise IT manager seeking secure telephony deployments, understanding and optimizing Service Level / Response Time is critical for delivering exceptional customer service and driving business success. This contact center KPI is invaluable for supervisors, team leads, and customer experience teams aiming for unified multichannel engagement and top-tier performance.
6. Customer Effort Score (CES)
Customer Effort Score (CES) is a crucial contact center KPI that measures how much effort a customer has to exert to get their issue resolved, find an answer, or complete a task. It's a valuable addition to your suite of contact center KPIs because it directly correlates with customer loyalty and future purchase behavior. Unlike traditional customer satisfaction surveys, which often focus on delighting customers, CES recognizes that reducing customer effort is a more powerful driver of loyalty. This makes it an especially relevant contact center KPI for businesses in the AE region striving to build strong, lasting customer relationships.
How CES Works:
CES is typically measured immediately following a customer interaction using a 5-point or 7-point scale. Customers are asked how much they agree with a statement like, "The company made it easy for me to resolve my issue." The lower the score, the less effort the customer had to expend. This contact center KPI is often analyzed alongside other metrics like resolution rates and satisfaction scores to gain a holistic view of customer experience.
Features and Benefits:
- Scale: Measured on a 5-point or 7-point scale.
- Timing: Collected immediately after interactions.
- Focus: Specifically targets ease and convenience.
- Predictive Power: Strong predictor of customer loyalty and repurchase behavior.
- Actionable Insights: Identifies friction points in the customer journey.
- Prioritization: Helps prioritize process improvements that reduce customer effort.
Pros:
- Strong Predictor of Loyalty: More directly linked to loyalty than traditional satisfaction metrics.
- Actionable: Pinpoints specific areas for improvement.
- Identifies Friction: Highlights problematic processes and systems.
- Prioritization: Helps focus efforts on high-impact changes.
Cons:
- Benchmarking: Relatively newer metric, making historical comparisons less readily available.
- Emotional Factors: May not fully capture the emotional nuances of the customer experience.
- External Influences: Can be affected by factors outside the contact center's direct control.
- Cross-Departmental Cooperation: Addressing issues may require collaboration across multiple departments.
Examples of Successful Implementation:
- Amazon Web Services: Improved customer retention by prioritizing the reduction of customer effort within their support interactions.
- Comcast: Reduced customer churn by 10% after implementing CES and addressing high-effort touchpoints.
Actionable Tips for Implementing CES:
- Identify Drivers: Analyze data to understand the primary causes of high customer effort within your organization.
- Map the Customer Journey: Visualize the customer experience to pinpoint friction points.
- Empower Agents: Provide agents with the authority and resources to resolve issues without unnecessary transfers.
- Streamline Processes: Reduce the steps required for common customer tasks.
- Proactive Communication: Implement strategies to preemptively address common customer queries and prevent avoidable contacts.
When and Why to Use CES:
CES is a valuable contact center KPI for any organization looking to improve customer loyalty and reduce churn. It is particularly beneficial for:
- Small to mid-size businesses: Scalable solutions for measuring and improving customer experience.
- Enterprise IT managers: Integration with existing telephony deployments (cloud or on-premise).
- Contact center supervisors and team leads: Data-driven insights for agent performance improvement.
- Customer experience teams: Unified view of multichannel engagement.
- Organizations in regulated sectors: Demonstrable improvements in customer service processes.
Popularized By: Matthew Dixon, Nick Toman, Rick DeLisi, CEB (now Gartner)
By focusing on reducing customer effort, businesses can create a smoother, more positive customer experience that fosters loyalty and drives repeat business. Implementing CES as a key contact center KPI provides the necessary insights to achieve these goals.
7. Agent Occupancy Rate
Agent Occupancy Rate is a crucial contact center KPI that measures the percentage of an agent's logged-in time spent actively handling customer interactions (talk time, email responses, chat sessions, etc.) or performing directly related after-call work, such as updating customer records or scheduling follow-ups. It's a vital metric for workforce efficiency, agent workload management, and cost optimization within contact centers, and its proper management is key to balancing operational efficiency with agent wellbeing. This KPI deserves its place on this list because it directly impacts both the bottom line and employee satisfaction, making it essential for contact center success.
How it Works:
Agent Occupancy Rate is calculated using the following formula:
(Handle Time) / (Handle Time + Available Time) × 100%
- Handle Time: The total time an agent spends interacting with a customer and completing related after-call work.
- Available Time: The time an agent is logged in and available to handle interactions, excluding breaks, meetings, and training.
The result is expressed as a percentage. For example, an occupancy rate of 80% indicates that an agent spends 80% of their logged-in time handling customer interactions and related tasks, and 20% available for new interactions.
Features and Benefits:
- Percentage-based measurement: Provides a clear, standardized view of agent utilization.
- Variable optimal rates: Acknowledges that ideal occupancy varies based on communication channels (voice, email, chat) and the complexity of customer interactions.
- Direct link to staffing: Plays a key role in determining appropriate staffing levels to meet service level targets.
- Insight into workforce efficiency: Provides a direct measure of how effectively agents' time is being utilized.
- Identification of staffing imbalances: Helps identify periods of overstaffing or understaffing.
- Impact on agent well-being: Directly correlates with agent burnout and turnover rates.
- Essential for capacity planning: Facilitates accurate forecasting and resource allocation.
Pros and Cons:
Pros:
- Key indicator of workforce efficiency and utilization.
- Helps identify understaffing or overstaffing situations.
- Influences agent burnout and turnover rates.
- Critical for accurate capacity planning.
Cons:
- Consistently high occupancy (typically >85-90%) can lead to agent burnout and reduced job satisfaction.
- Excessively low occupancy is cost-inefficient and indicates potential overstaffing.
- Doesn't inherently account for the complexity of individual interactions.
- Can create pressure on agents to minimize break and training time, impacting their well-being and development.
Examples of Successful Implementation:
- Companies like Zappos reportedly maintain occupancy rates around 83%, intentionally providing agents with sufficient "breathing room" to build rapport with customers and avoid feeling overwhelmed.
- Organizations like American Express adjust their occupancy targets seasonally to maintain service quality during peak periods and avoid overworking agents.
Actionable Tips for Contact Centers in the AE Region:
- Target occupancy rates between 75-85% for most contact centers: This range generally provides a good balance between efficiency and agent well-being.
- Adjust targets based on interaction complexity and channel: More complex interactions and channels (e.g., technical support) may warrant lower occupancy targets.
- Monitor the correlation between occupancy and quality metrics: Ensure that higher occupancy doesn't negatively impact customer satisfaction or first-call resolution rates.
- Utilize skills-based routing: Distribute workload effectively across teams based on agent expertise, ensuring balanced occupancy and efficient handling of various customer inquiries.
- Factor in "breath time" between challenging interactions: Allow agents short breaks between demanding calls or chats to reduce stress and maintain performance.
Popularized By:
- ICMI (International Customer Management Institute)
- SWPP (Society of Workforce Planning Professionals)
By carefully monitoring and managing Agent Occupancy Rate, contact centers in the AE region can optimize their workforce efficiency, enhance agent well-being, and ultimately deliver a superior customer experience. This KPI is invaluable for small to mid-size businesses seeking scalable solutions, enterprise IT managers, contact center supervisors, customer experience teams, and organizations in regulated sectors needing to balance performance with compliance.
7 Critical Contact Center KPIs Compared
| KPI | 🔄 Implementation Complexity | 🛠️ Resource Requirements | 📊 Expected Outcomes | 💡 Ideal Use Cases | ⭐ Key Advantages |
|---|---|---|---|---|---|
| First Call Resolution (FCR) | Moderate: requires multichannel tracking and robust knowledge bases | Medium: agent training, call routing, survey tools | Higher customer satisfaction, lower repeat contacts, operational cost reduction | Contact centers focused on quality and customer retention | Strong link to customer satisfaction and cost savings; reveals agent training gaps |
| Average Handle Time (AHT) | Low to Moderate: relies on time tracking systems integrated with contact software | Medium: workforce planning tools and analytics | Improved efficiency, cost management, optimized staffing | Operations focusing on cost control and agent productivity | Essential for workforce planning; identifies efficiency opportunities |
| Customer Satisfaction Score (CSAT) | Low: simple survey deployment post-interaction | Low to Medium: survey tools and feedback analysis | Direct voice-of-customer feedback for service improvements | Quick quality checks and agent performance measurement | Immediate, actionable customer feedback; easy to understand |
| Net Promoter Score (NPS) | Low: straightforward survey with simple calculation | Low: customer survey and analysis platform | Insight into customer loyalty and advocacy | Long-term brand health and loyalty measurement | Standardized metric for benchmarking; predicts growth |
| Service Level / Response Time | Moderate: real-time monitoring and adherence to thresholds | Medium to High: staffing and scheduling systems | Improved accessibility, responsiveness, better customer perception | Contact centers with strict SLAs and contractual obligations | Clear indicator of accessibility; vital for capacity planning |
| Customer Effort Score (CES) | Low to Moderate: post-interaction surveys focused on effort | Low: survey tools combined with process analysis | Identifies friction points, enhances loyalty by reducing customer effort | Organizations aiming to simplify customer journeys | Strong predictor of loyalty; drives targeted process improvements |
| Agent Occupancy Rate | Moderate: requires detailed time and activity tracking | Medium: workforce management and scheduling tools | Balanced efficiency with agent wellbeing, reduces burnout | Workforce optimization and agent workload management | Key for measuring utilization; helps prevent agent burnout |
Optimize Your Contact Center with the Right KPIs
From First Call Resolution (FCR) and Average Handle Time (AHT) to Customer Satisfaction (CSAT) and Net Promoter Score (NPS), the contact center KPIs discussed in this article provide a powerful toolkit for evaluating and enhancing your customer experience. By focusing on these metrics, particularly Service Level/Response Time and Customer Effort Score (CES), you gain a holistic understanding of your contact center's performance, enabling you to pinpoint areas of strength and weakness. Mastering these contact center KPIs empowers you to make data-driven decisions, optimize agent performance, and ultimately, cultivate stronger customer relationships and loyalty, leading to increased revenue and a competitive edge in the AE region.
To further optimize your contact center’s performance, consider tracking these 10 essential call center metrics as outlined by Call Criteria's insightful look at metrics for 2025. This resource provides a deeper dive into additional metrics that can contribute to a comprehensive performance analysis.
For businesses in regulated sectors like healthcare, finance, and logistics, where compliance and security are paramount, understanding and managing these KPIs becomes even more critical. Implementing robust systems for tracking and analyzing these contact center KPIs is no longer a luxury but a necessity for thriving in today's competitive market.
Ready to transform your contact center into a well-oiled, customer-centric machine? Cloud Move offers advanced analytics, automated reporting, and seamless CRM integration to streamline your contact center KPI tracking and analysis. Explore the power of data-driven decision-making with Cloud Move and book a free demo today to discover how we can help elevate your contact center performance.
